Profiling PHP with Xdebug on Mac
See also:Installing Xdebug on macOS High Sierra
First, install PHP on a development server. Then, install Xdebug. There is an installation manual at the Xdebug site.
Check whether the xdebug extension will be loaded. Search for the zend_extension=xdebug.so line and add it if missing.
zend_extension=xdebug.so
Check and set the paremeters
[xdebug]
xdebug.start_with_request = default
xdebug.profiler_append = 0

; enable profiling by setting this to profile
xdebug.mode = profile

; where to store the callgrind files
; this folder must be writeable by the webserver
xdebug.output_dir = /tmp

; suffix the filename with timestamp (microseconds)
; for example: callgrind_1179434749_642382.out
xdebug.profiler_output_name = callgrind_%u.out
Now start or restart your webserver to load the modifications
Open a the site you want to profile in a webbrowser. When everything went good, the php script will be profiled and the callgrind profiling output will be written to /tmp. The file name is something like "callgrind_1179434749_642382.out". With the above configuration you will get a separate callgrind file for every request.
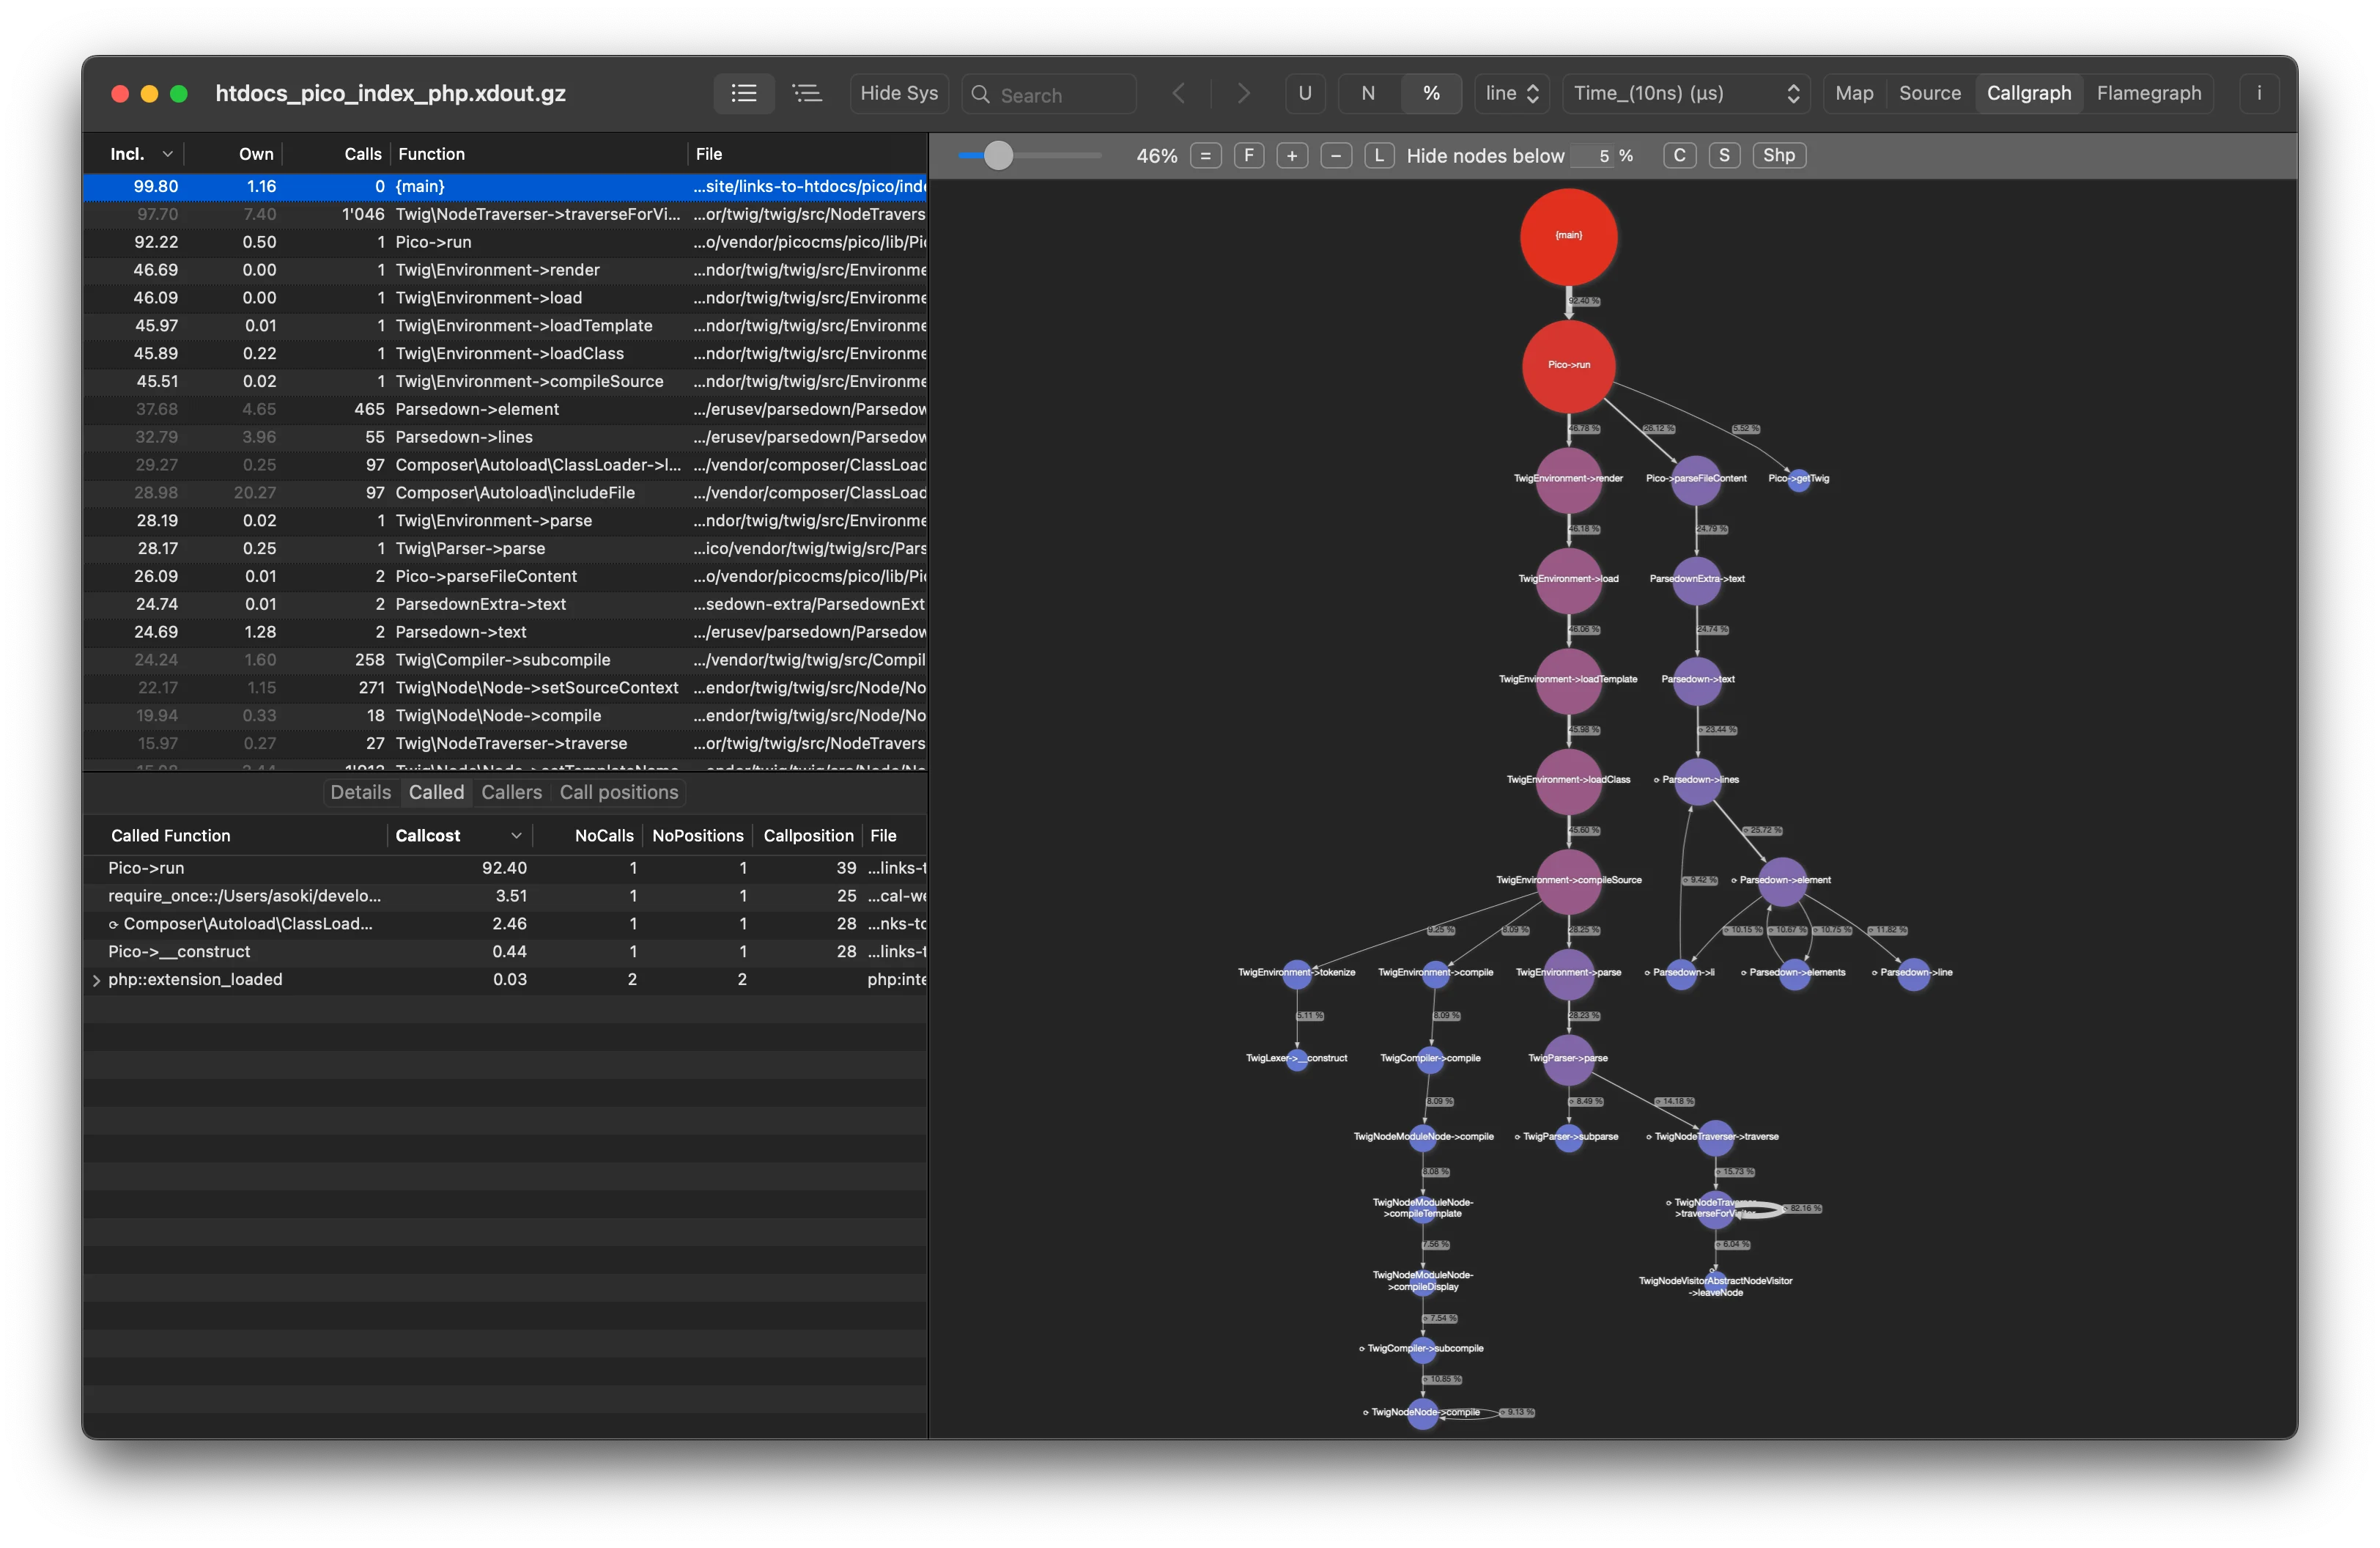
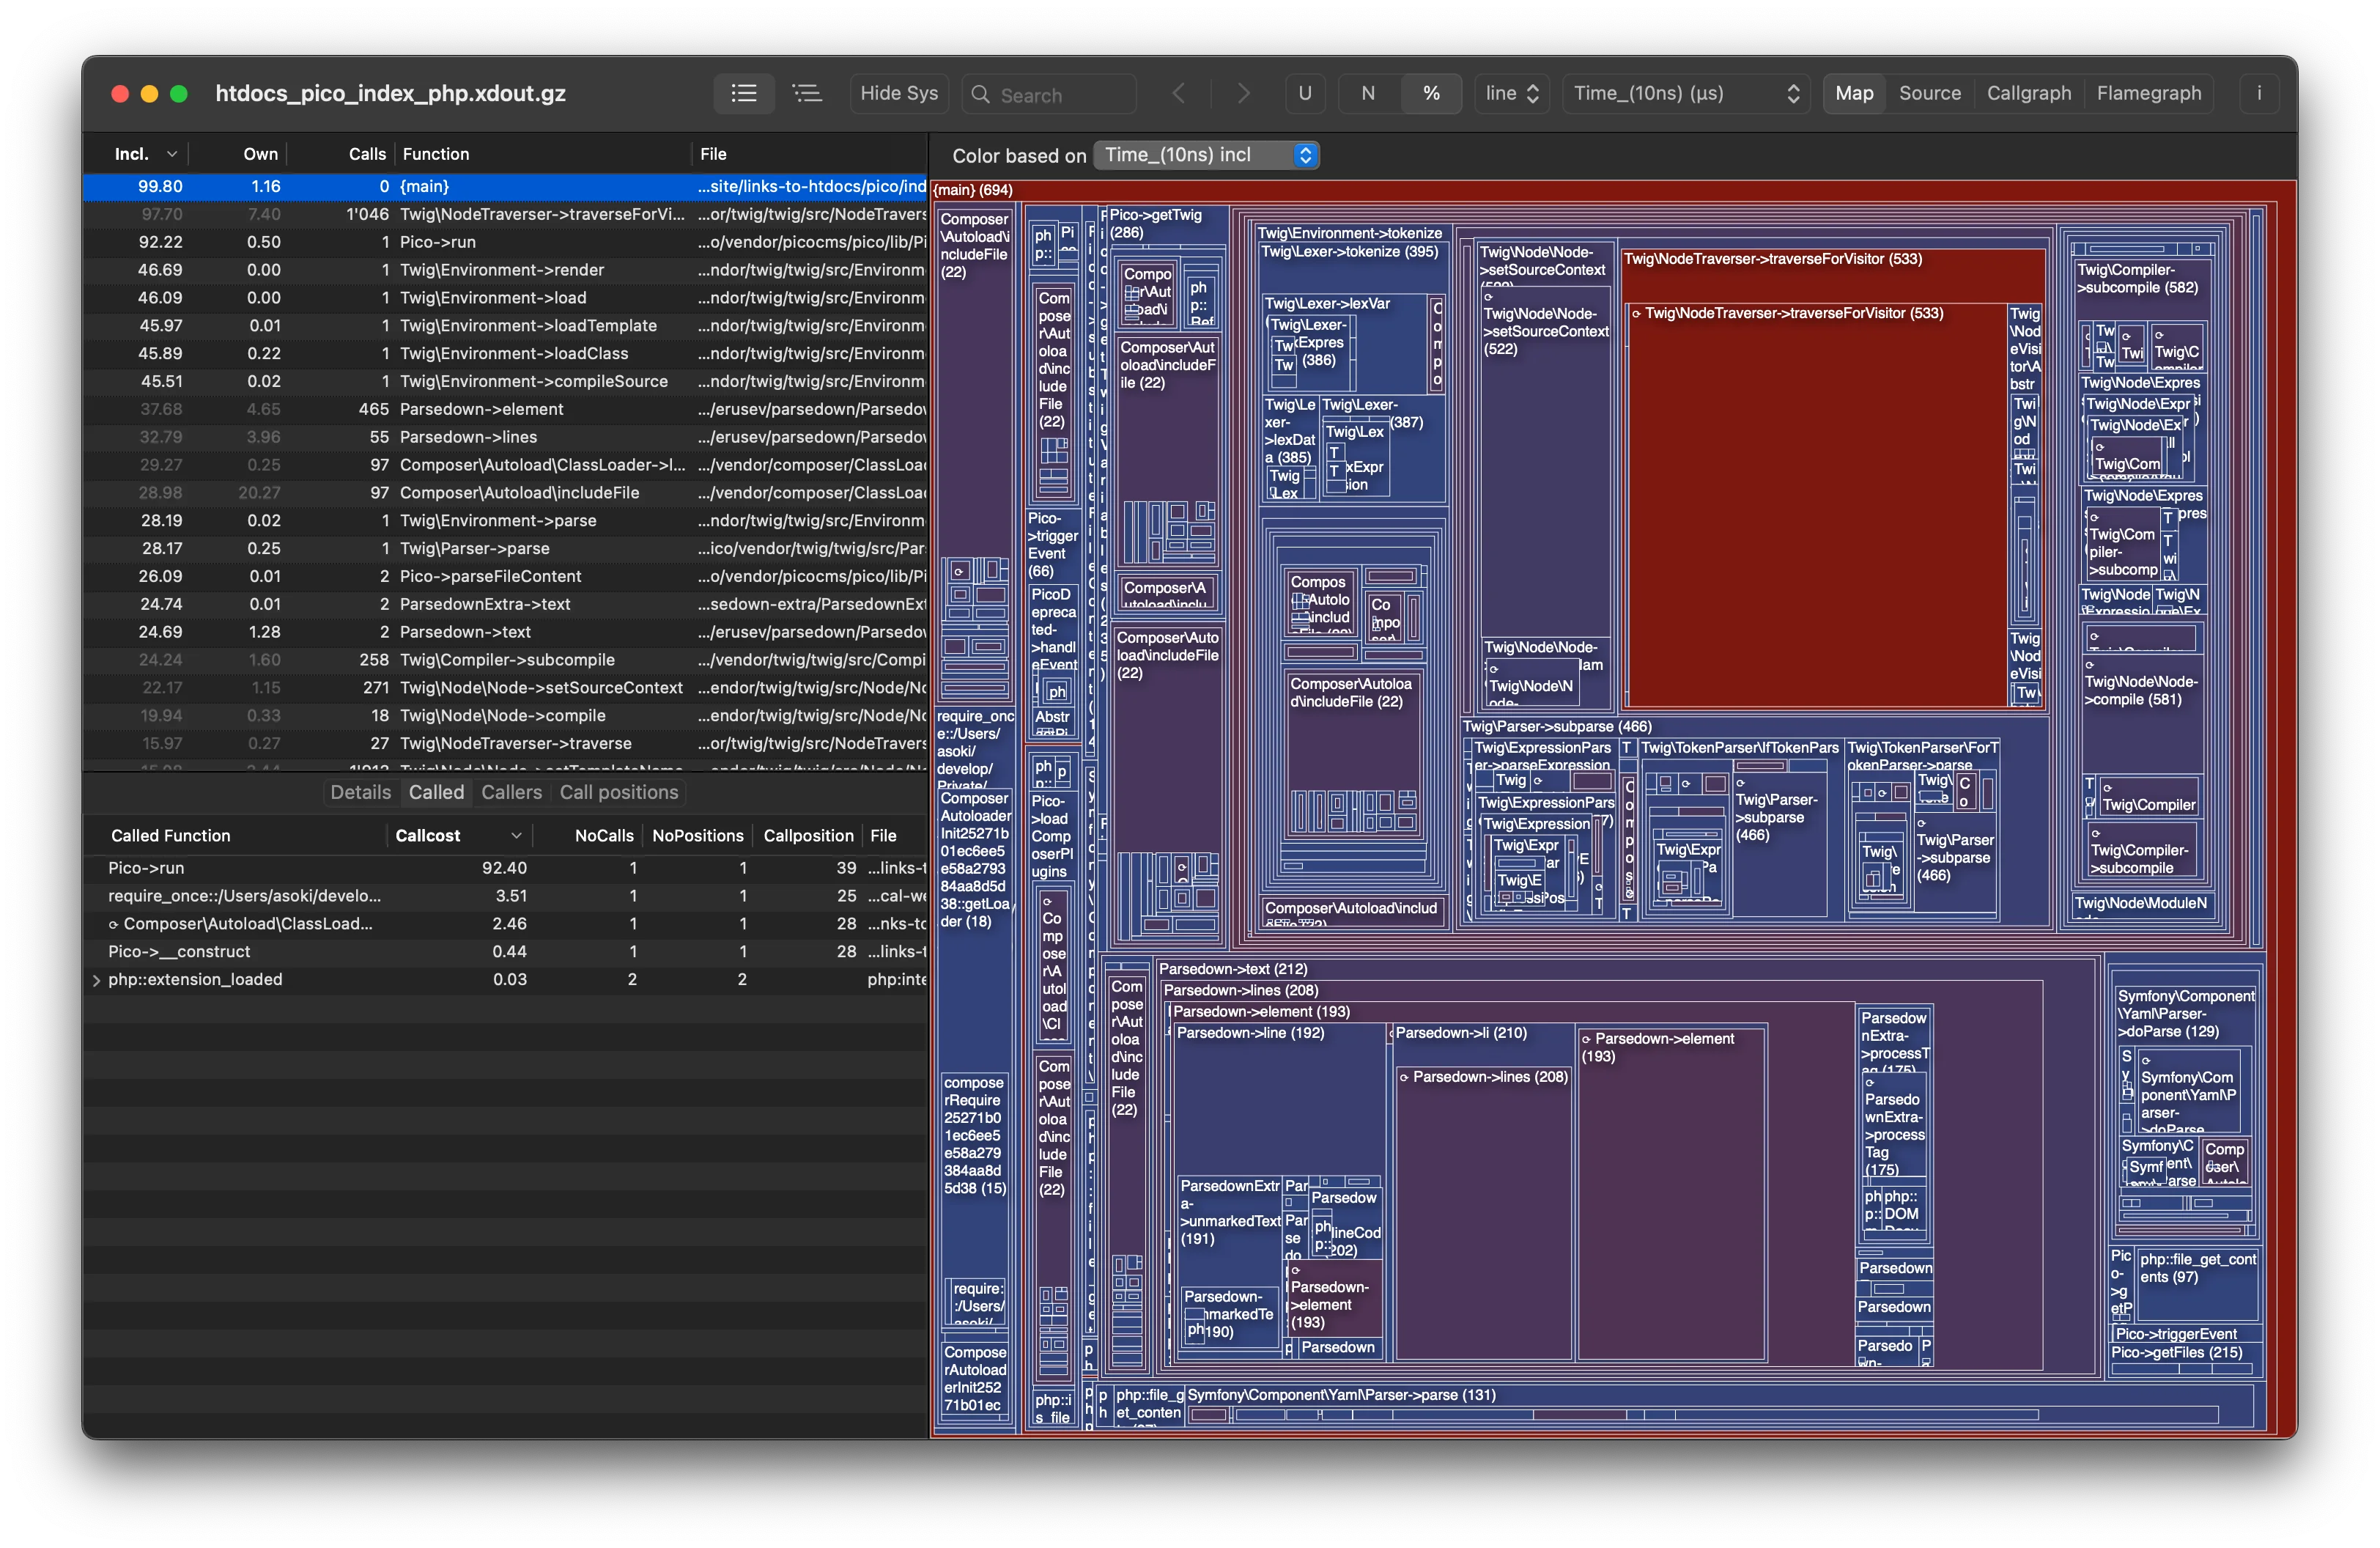
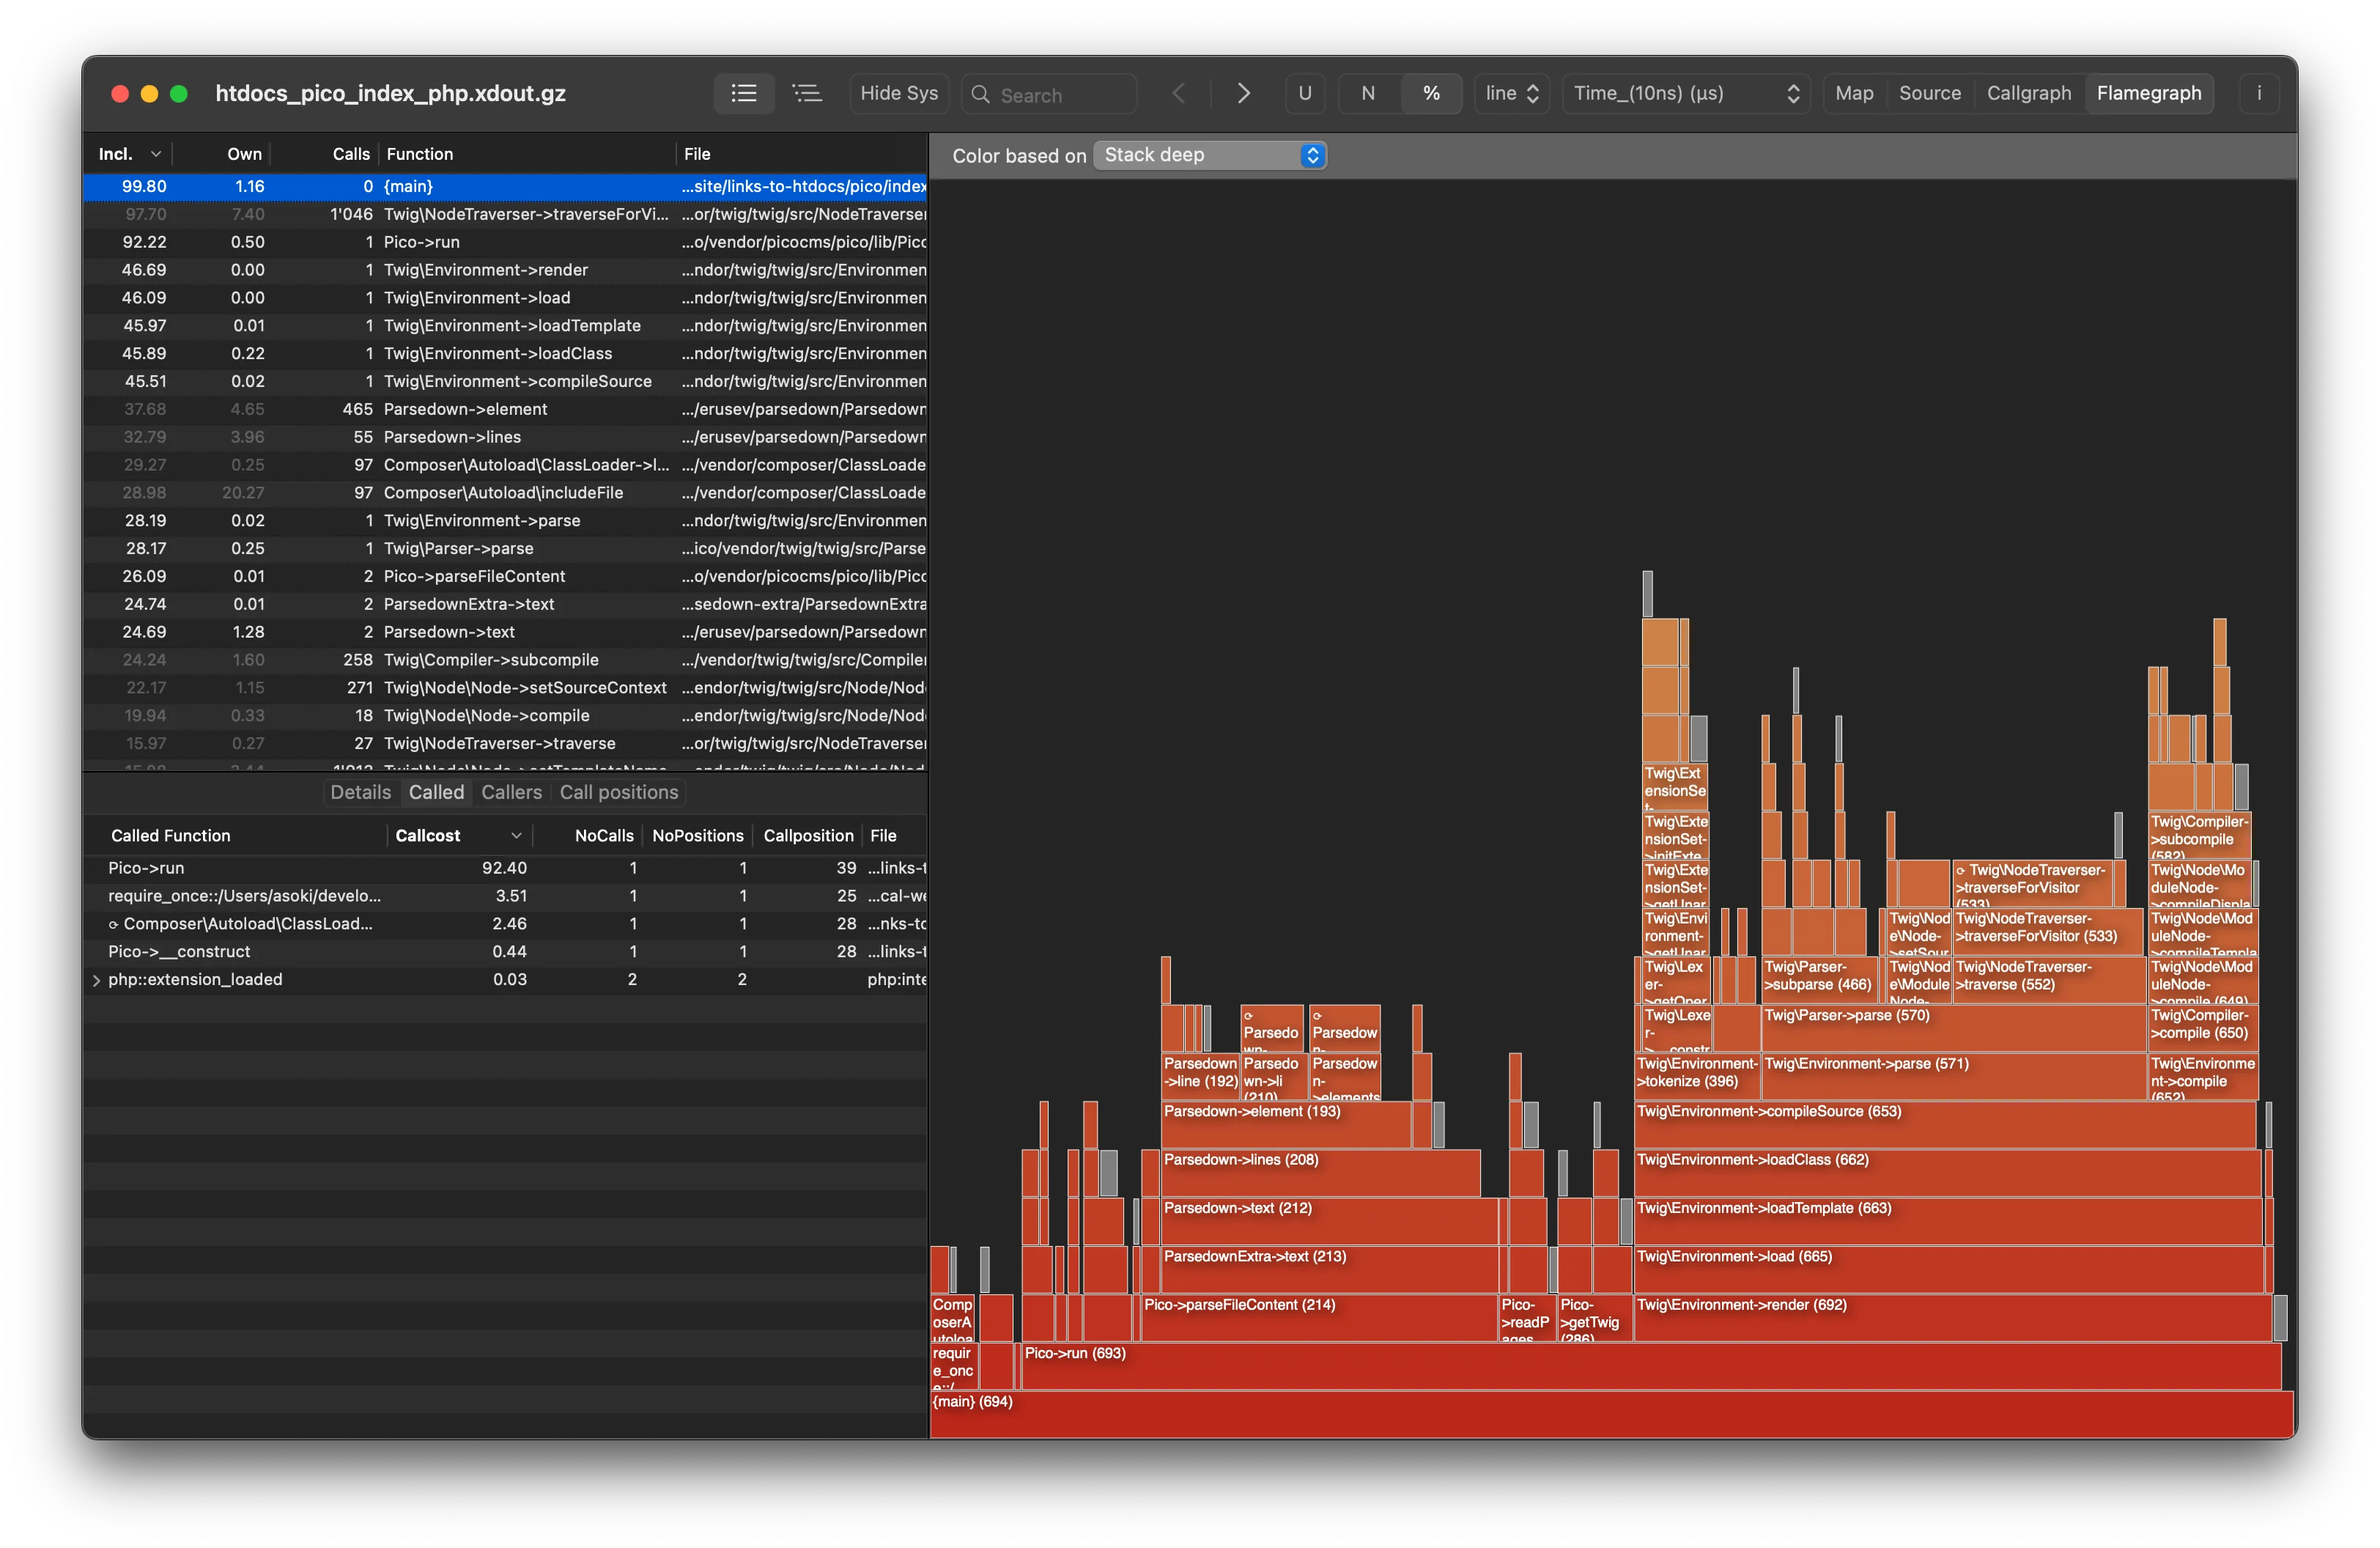
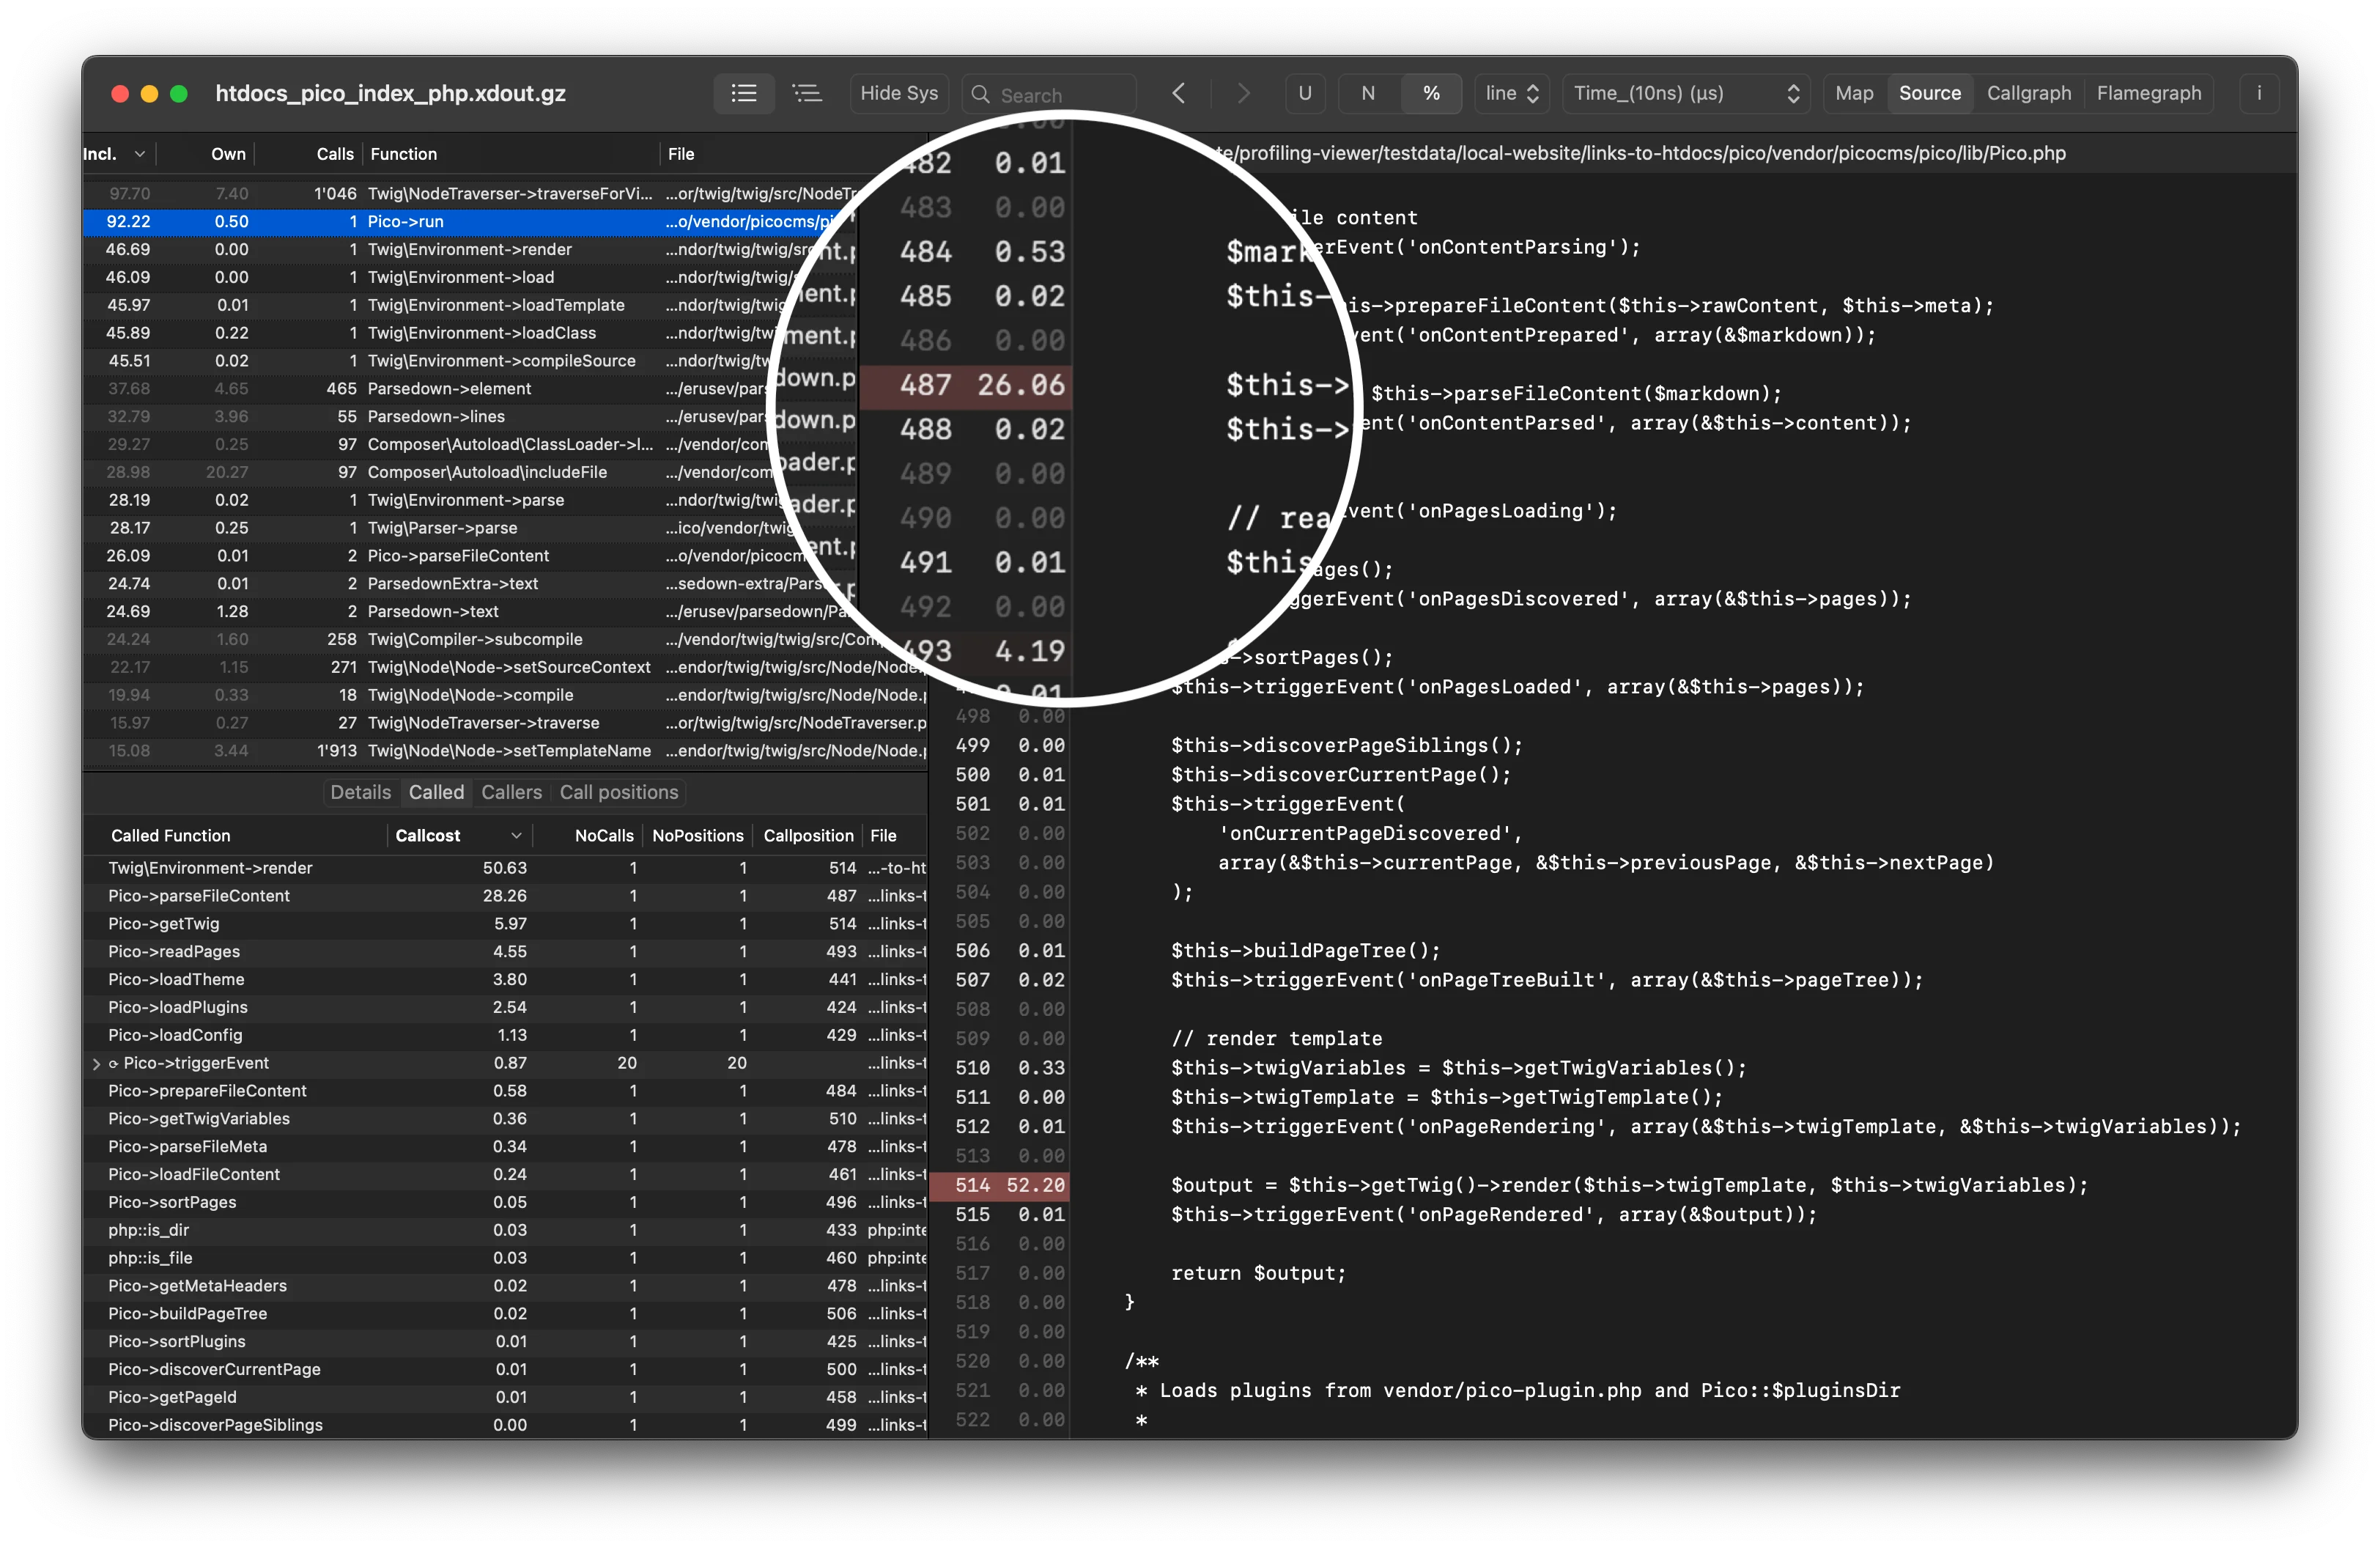
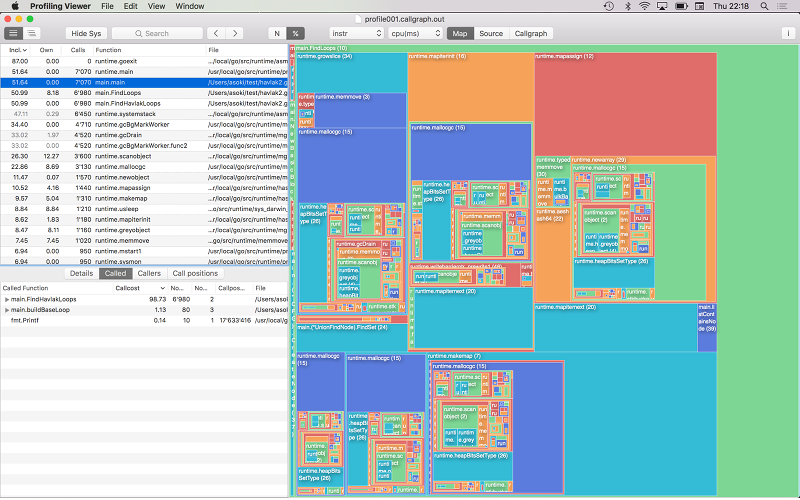
To visualize the callgrind file on the Mac, open the "callgrind_*.out" files with Profiling Viewer and you will get treemaps, callgraphs, heatmaps and annotated source code (something like a code coverage). You can also print all the chars as PDF. Since Xdebug version 2.6 it is also possible to profile and analyze the memory usage of your PHP code.
Profiling Golang with pprof and callgrind
To profile go Programs, install the Go programming language, for example under /usr/local/go (this is the default installation path on macOS)
There is a somewhat older tutorial about profiling go programs at https://blog.golang.org/profiling-go-programs. This article points to a github repository with the sourcecodes used in the example: https://github.com/rsc/benchgraffiti/.
I will use the file havlak2.go for this demo. You can download a copy for example here: http://profilingviewer.com/faq/files/havlak2.go
Create a new folder and download the havlak2.go file
#create the test folder in your home directory
mkdir ~/test
#chage into the testfolder
cd ~/test

#download the file havlak2.go
curl http://profilingviewer.com/faq/files/havlak2.go -o havlak2.go
#build the file
go build havlak2.go

#profile it with pprof and write the profiling data into havlak2-cpu.prof
#this can take a few seconds...
./havlak2 -cpuprofile="havlak2-cpu.prof"
# of loops: 76000 (including 1 artificial root node)

#open the generated profiling data and export it as callgrind file
go tool pprof havlak2 havlak2-cpu.prof
Entering interactive mode (type "help" for commands)
callgrind[press enter]
Generating report in profile001.callgraph.out
quit[press enter]
The callgrind data is exported to profile001.callgraph.out
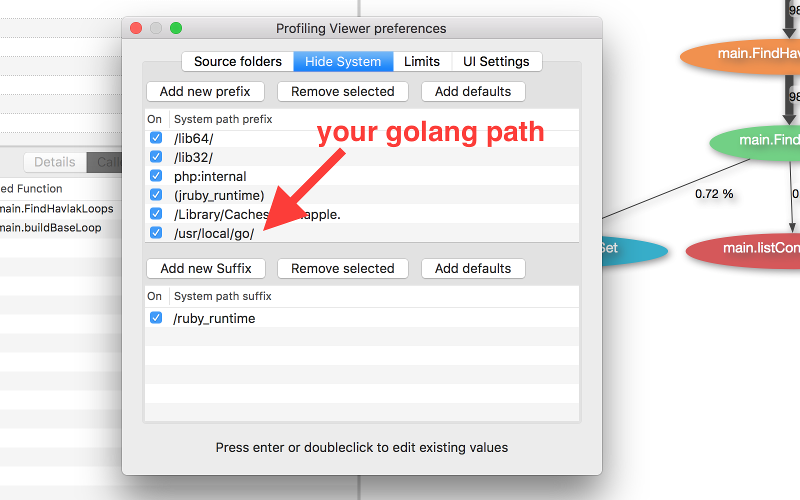
To use the hide-sys feature of Profiling Viewer you must enter the path of your Golang installation under Preferences/Hide System.
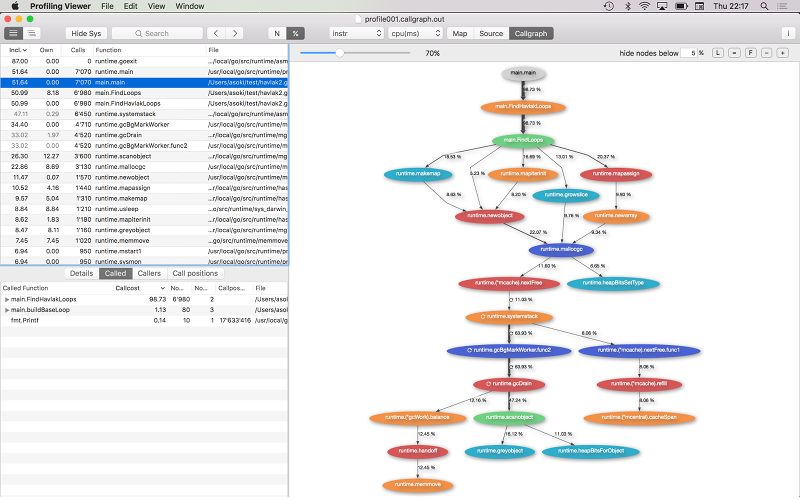
Open the file "profile001.callgraph.out" with Profiling Viewer
