Callgrind viewer for macOS

Profiling Viewer for macOS opens and visualizes callgrind files. Runs natively on both Apple silicon and Intel® based Mac computers. You can use treemap, callgraph, flame graph, sortable list or call tree to identify and analyze functions where your application spends more time than expected. It also supports reading gzip compressed profiling files.
For example, you can open callgrind profiler files generated by the Xdebug extension for PHP, php-memprof, Valgrind, Ruby ruby-prof, Python cProfile with pyprof2calltree, gperftools-pprof, Golang with pprof, Node.js with Valgrind or nodegrind and many other profiling tools with callgrind file output.
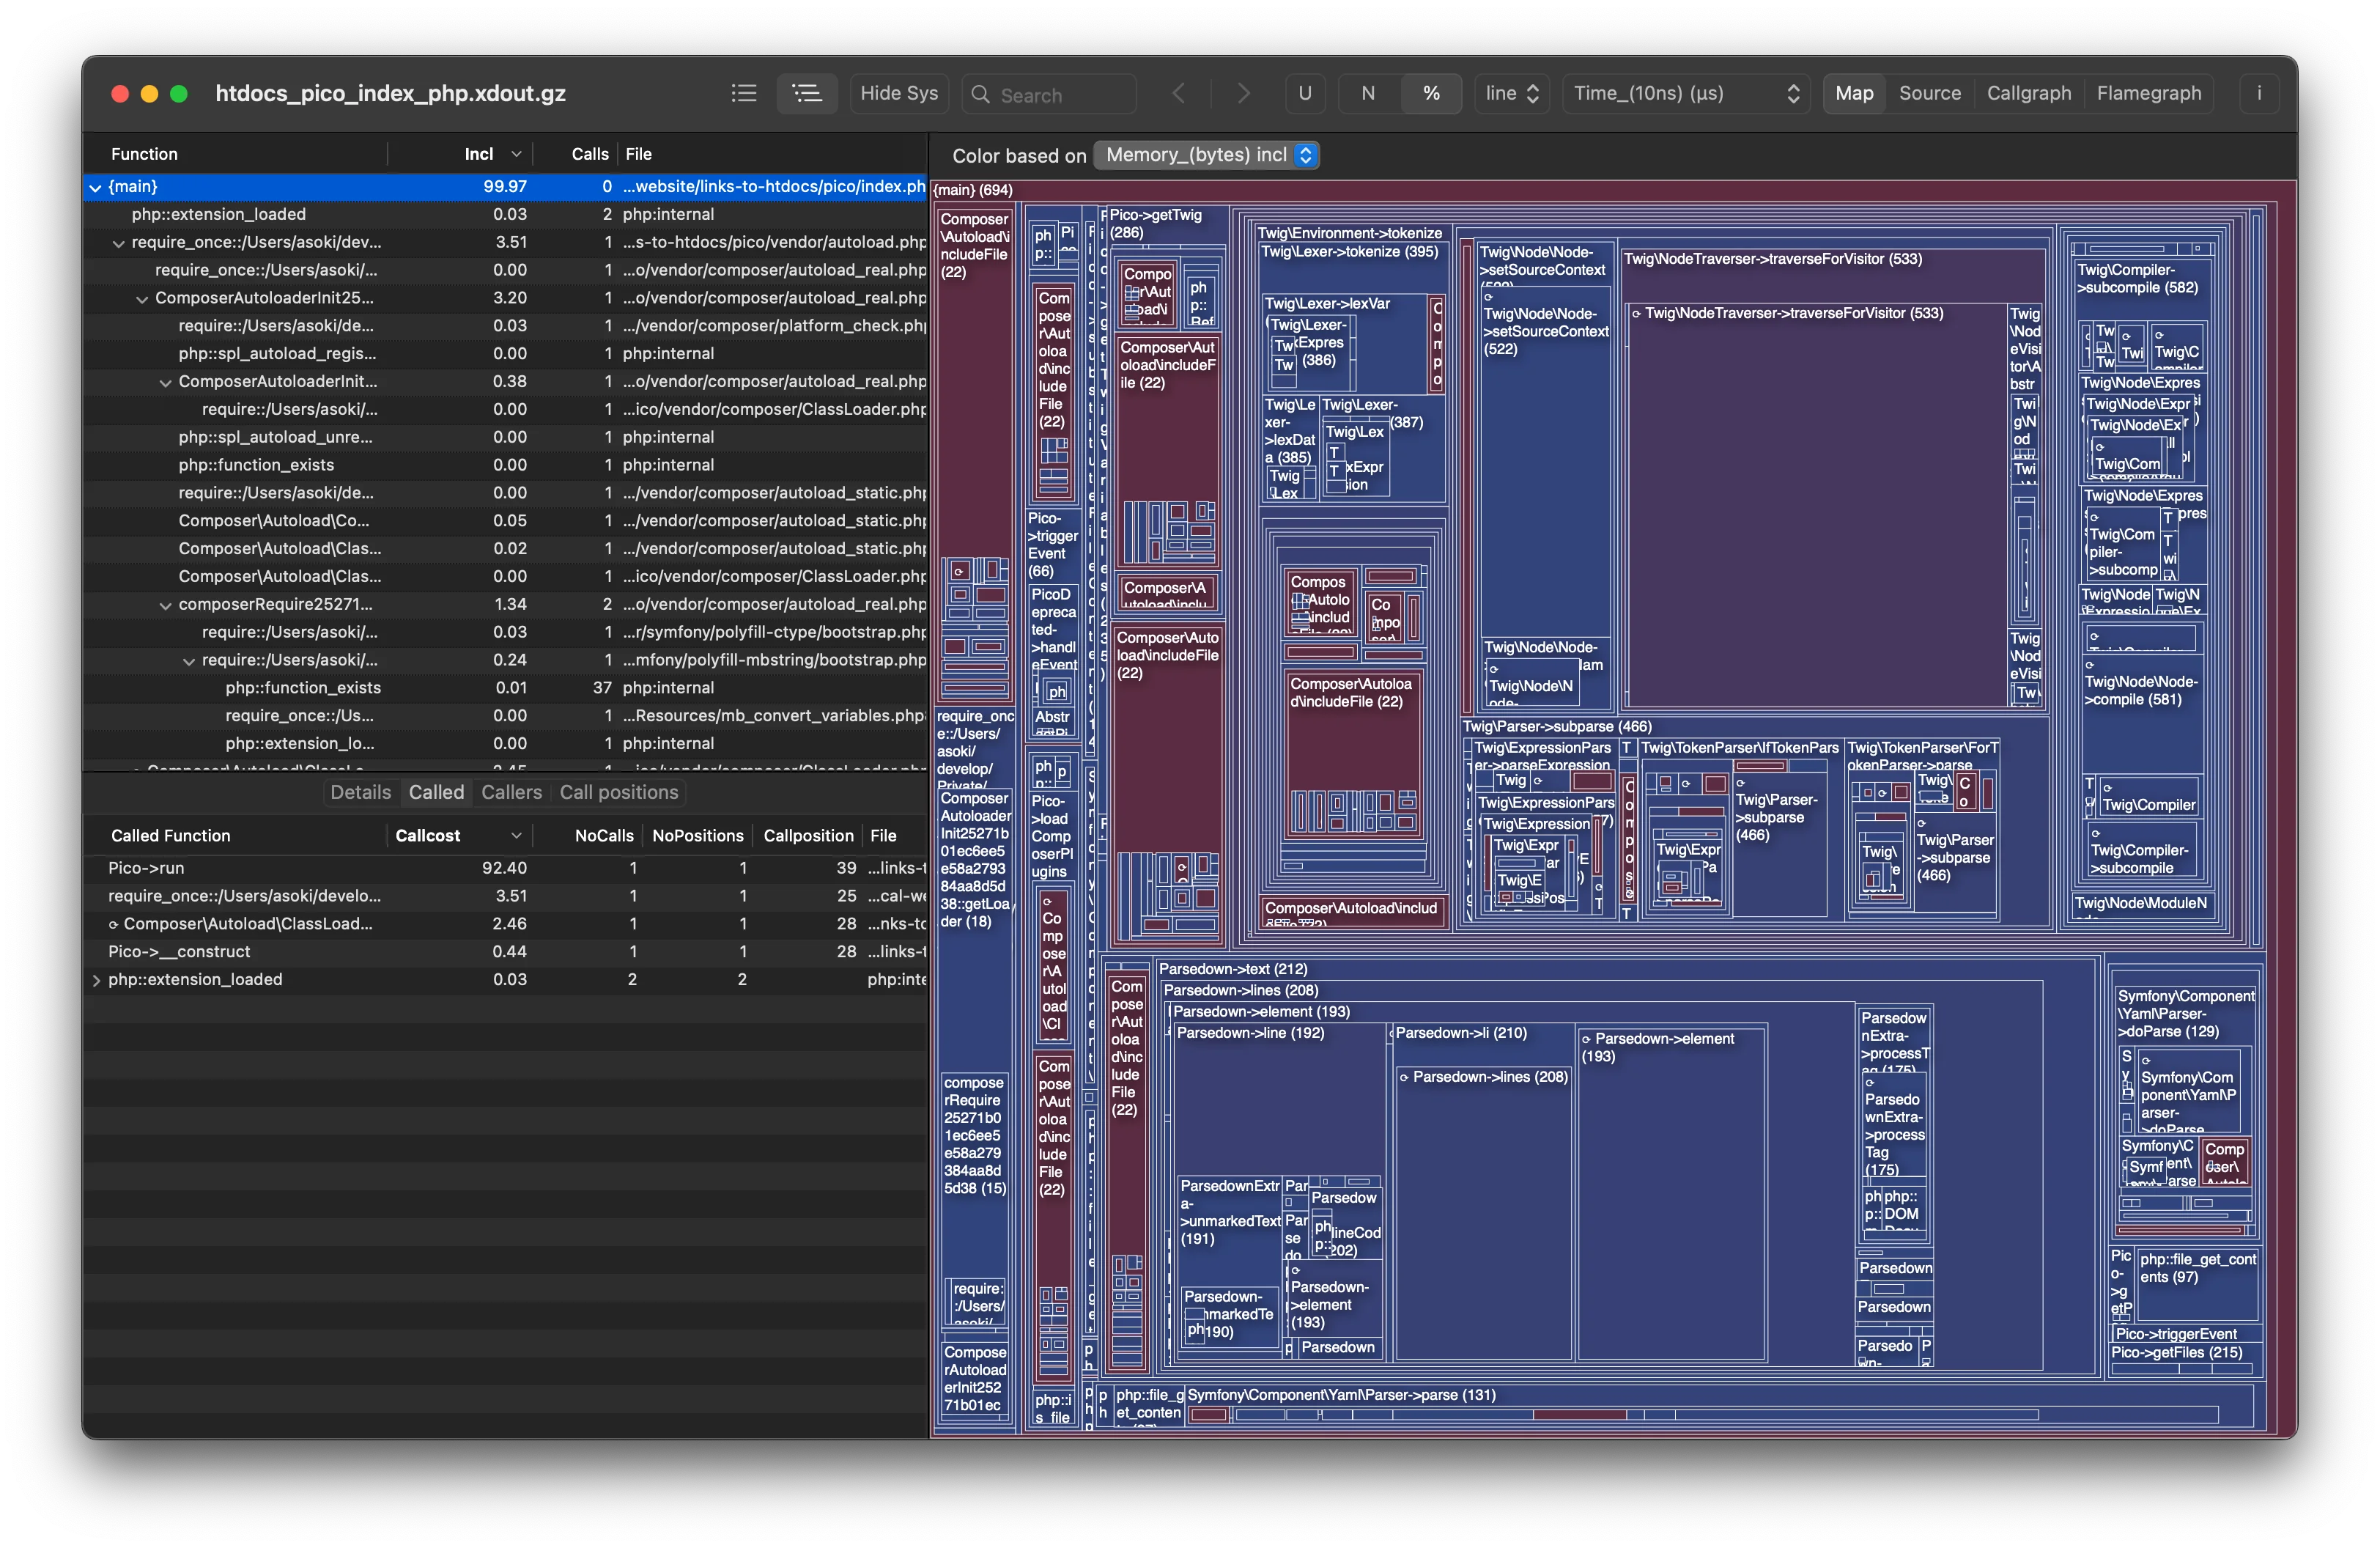
Xdebug added support for memory profiling php scripts. Profiling Viewer already handles multiple types of costs. Just open the generated file and select between Time and Memory costs types.
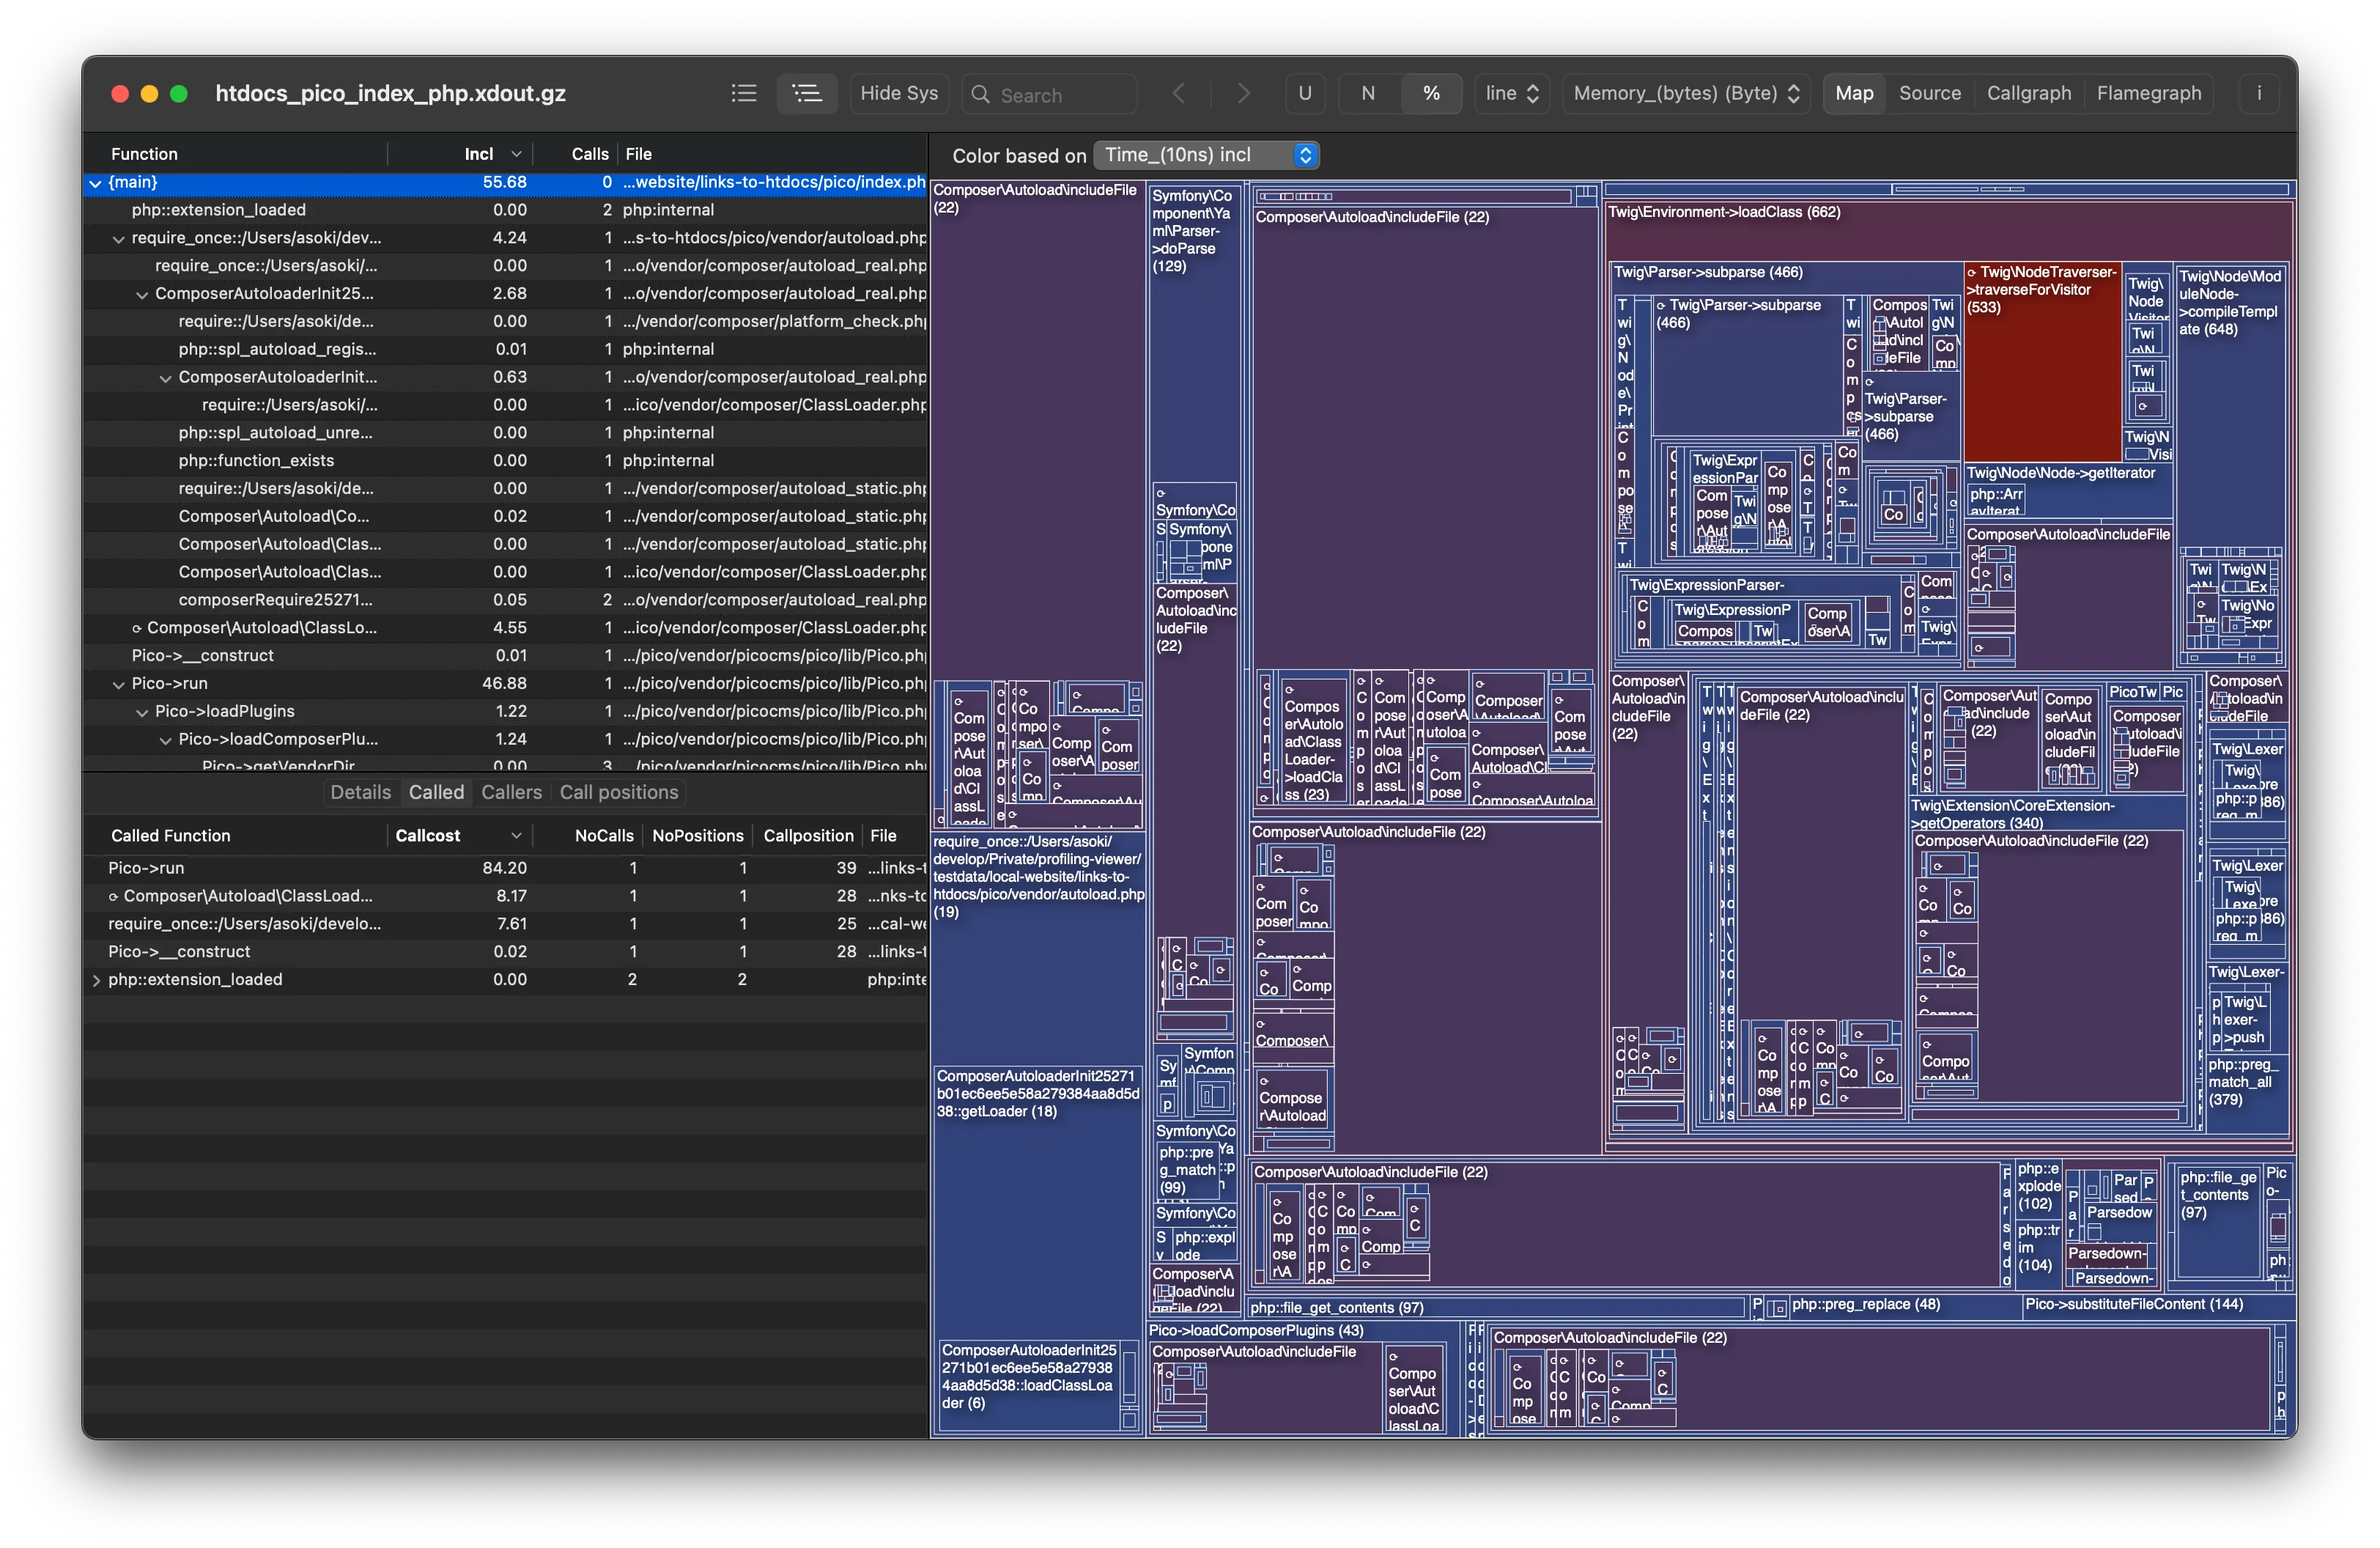
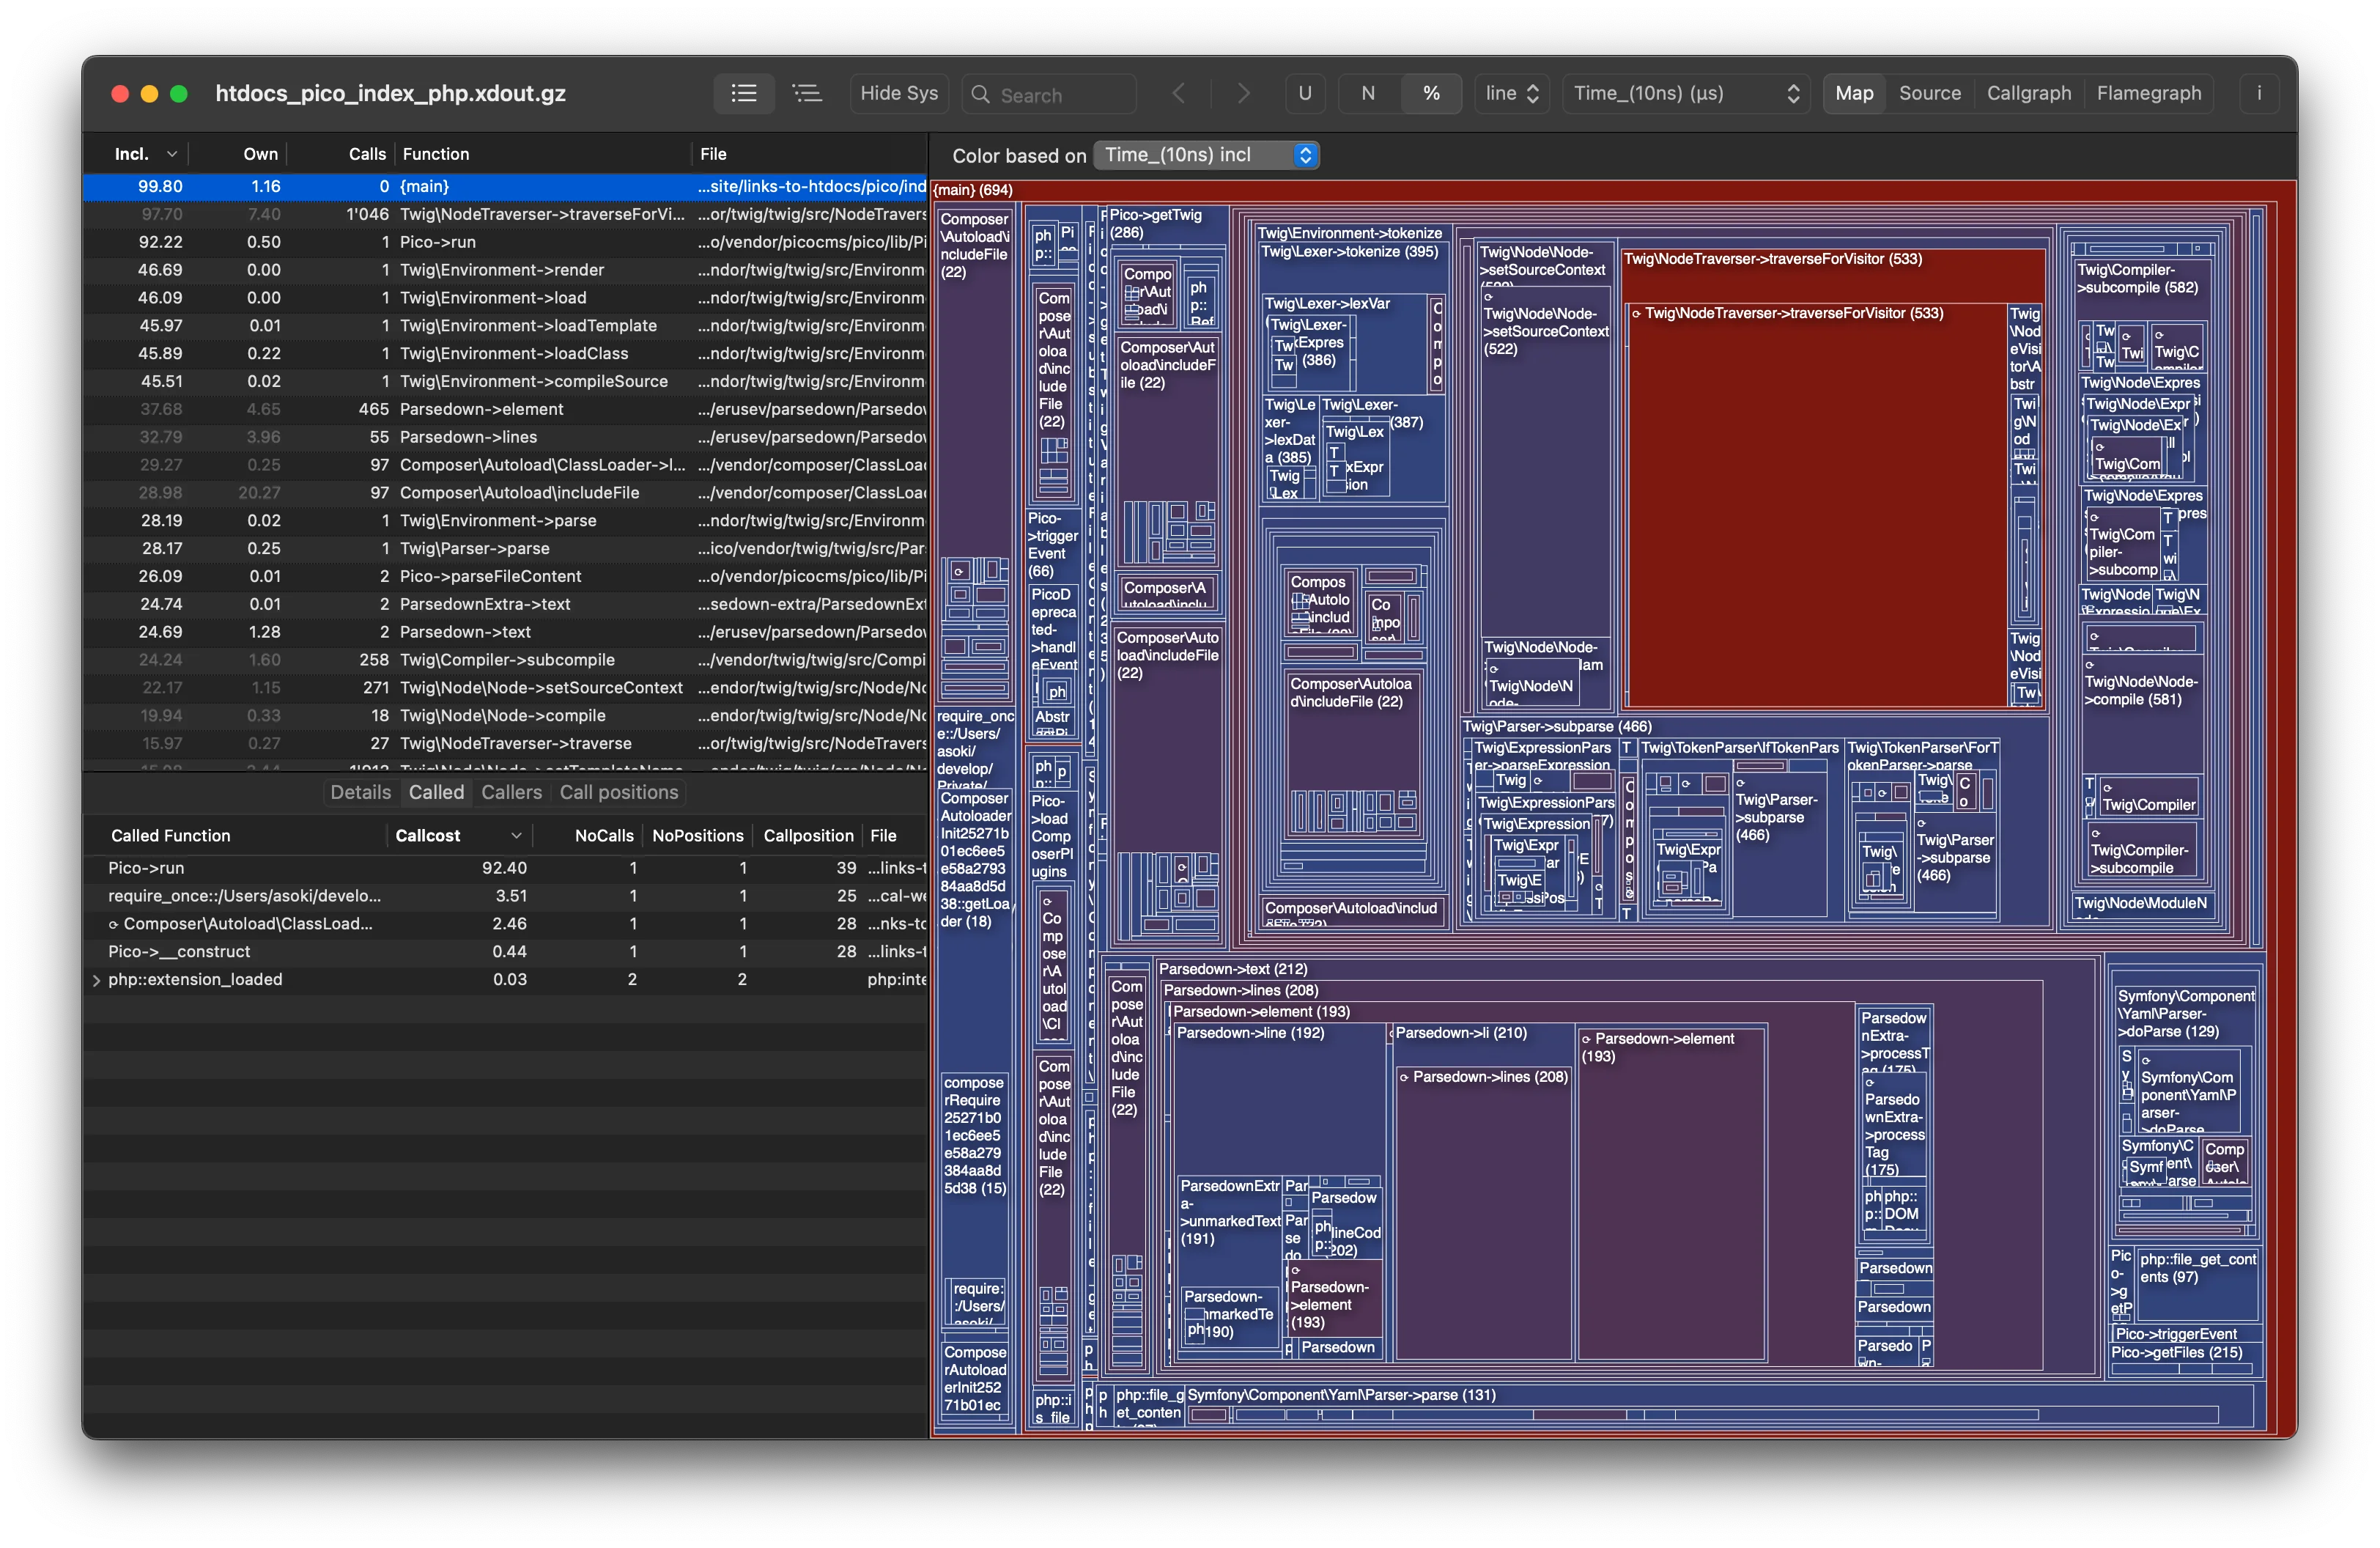
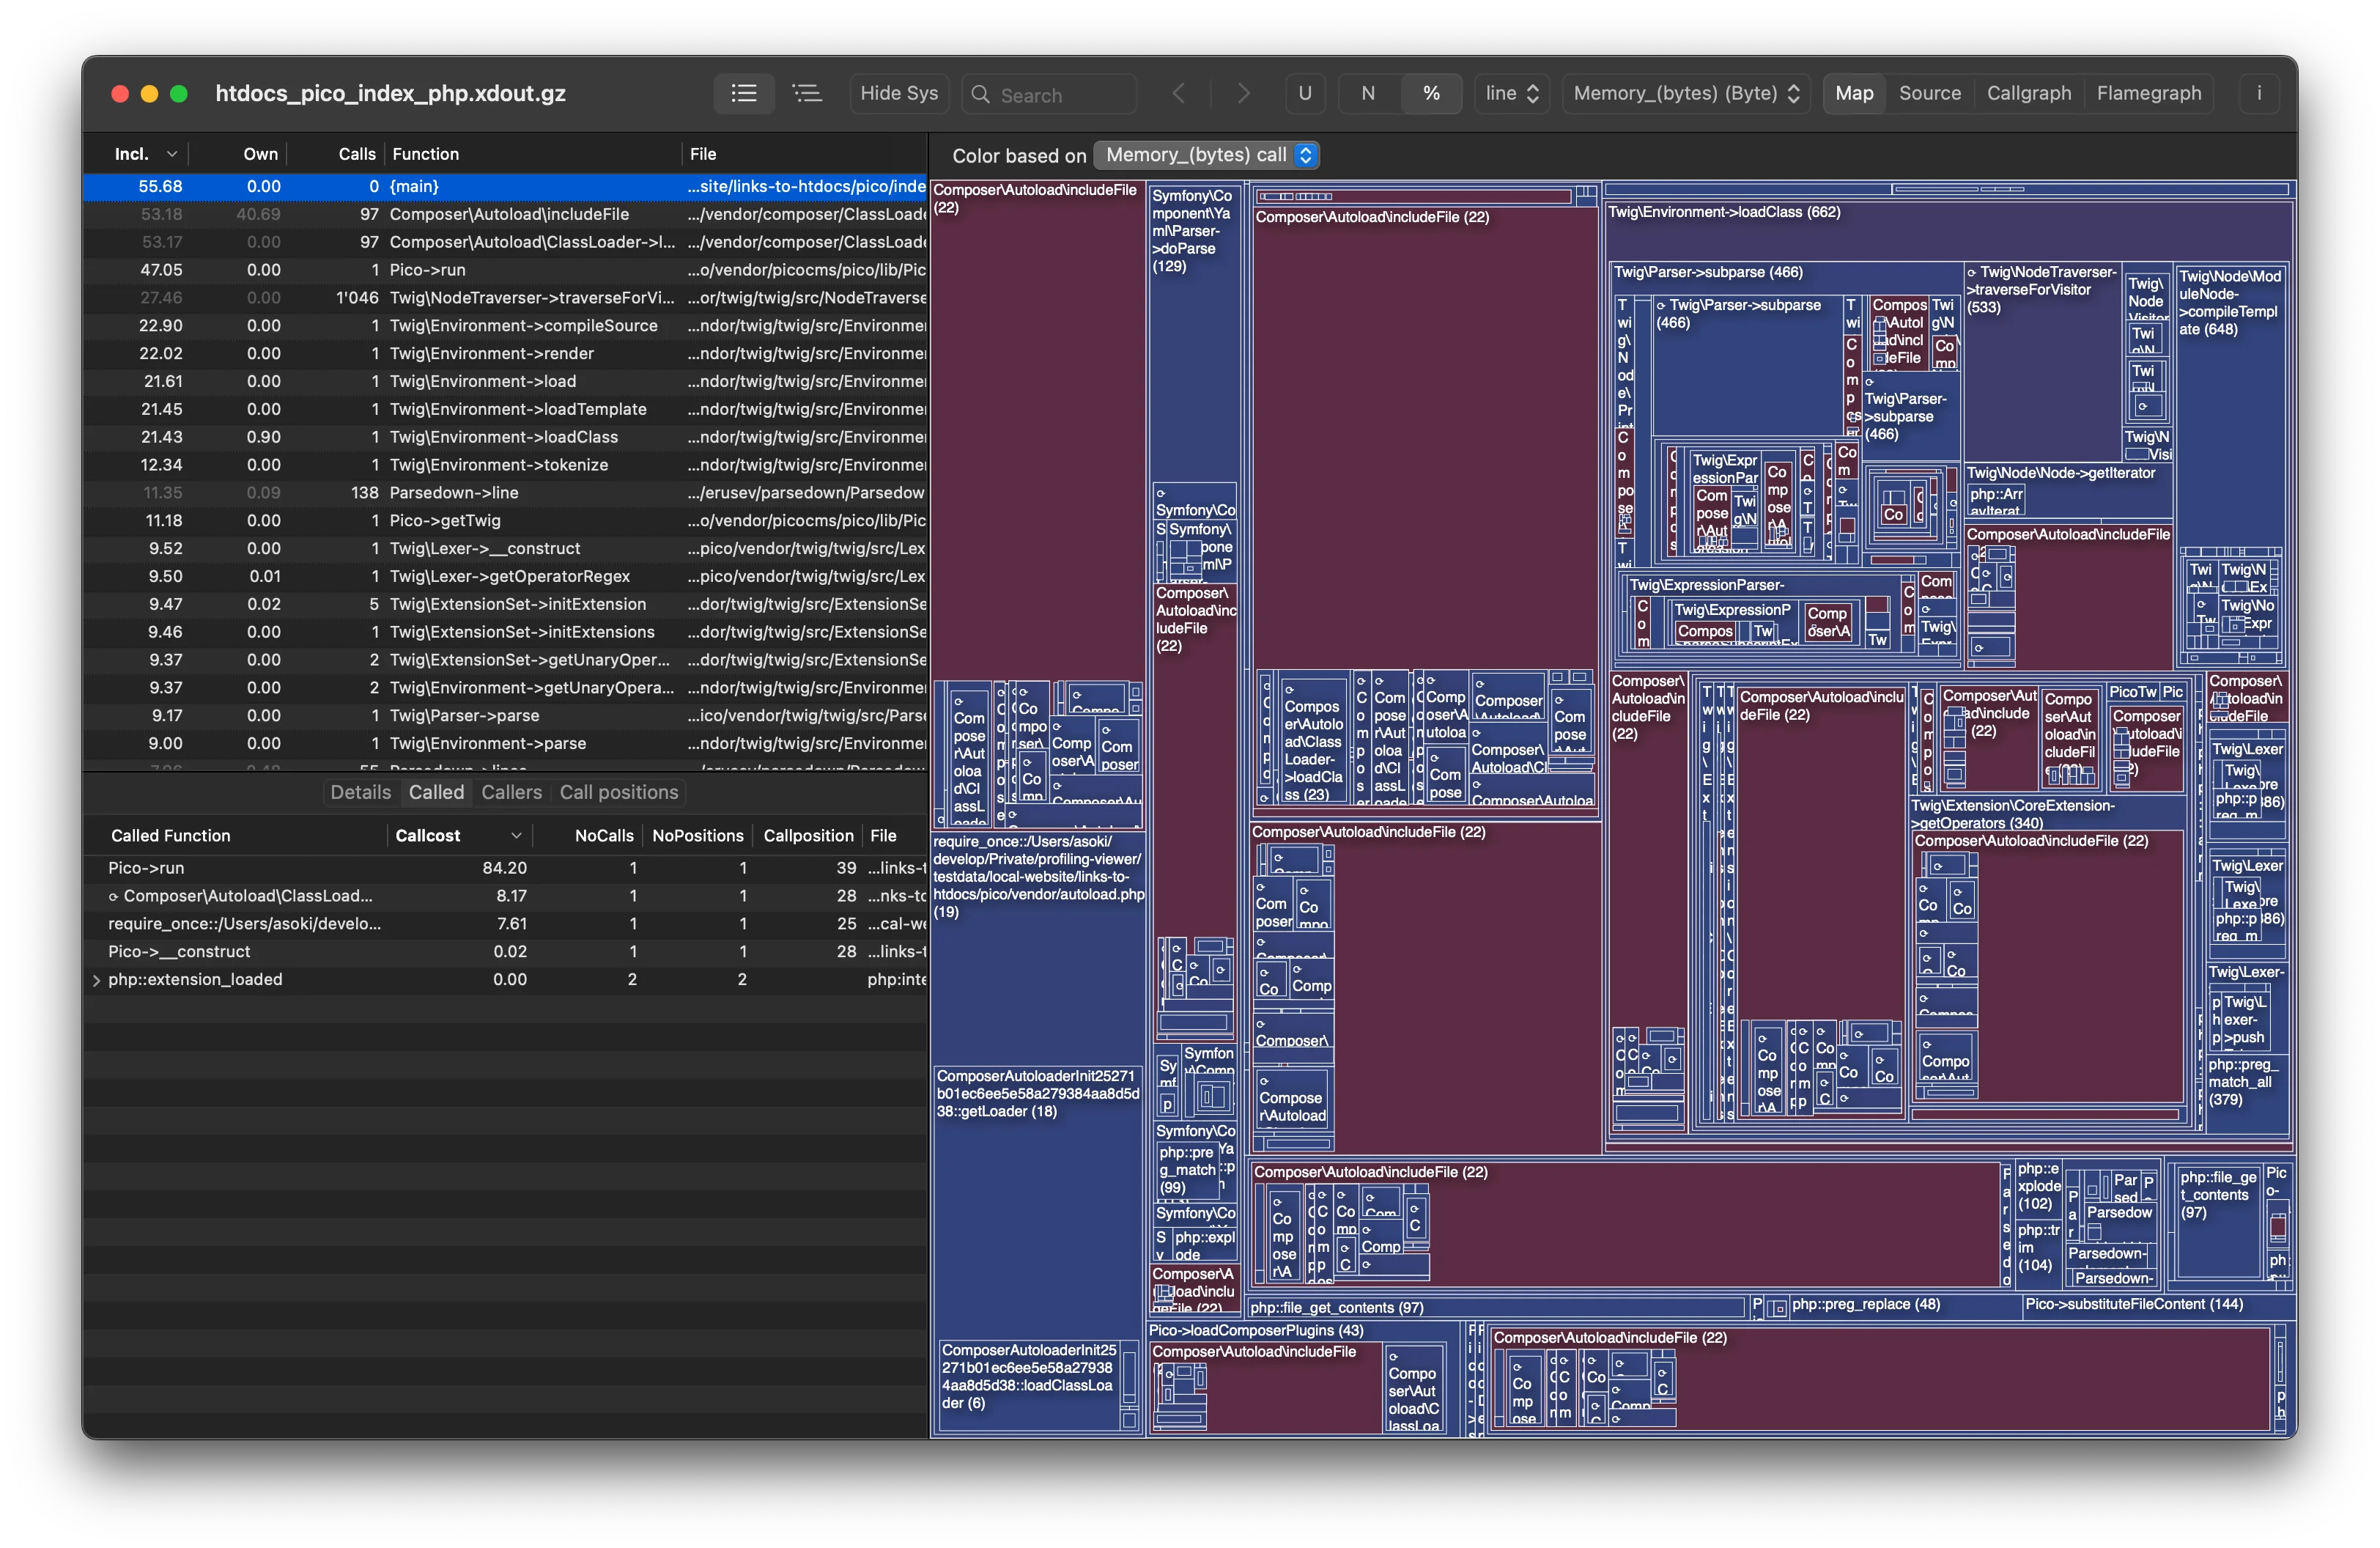
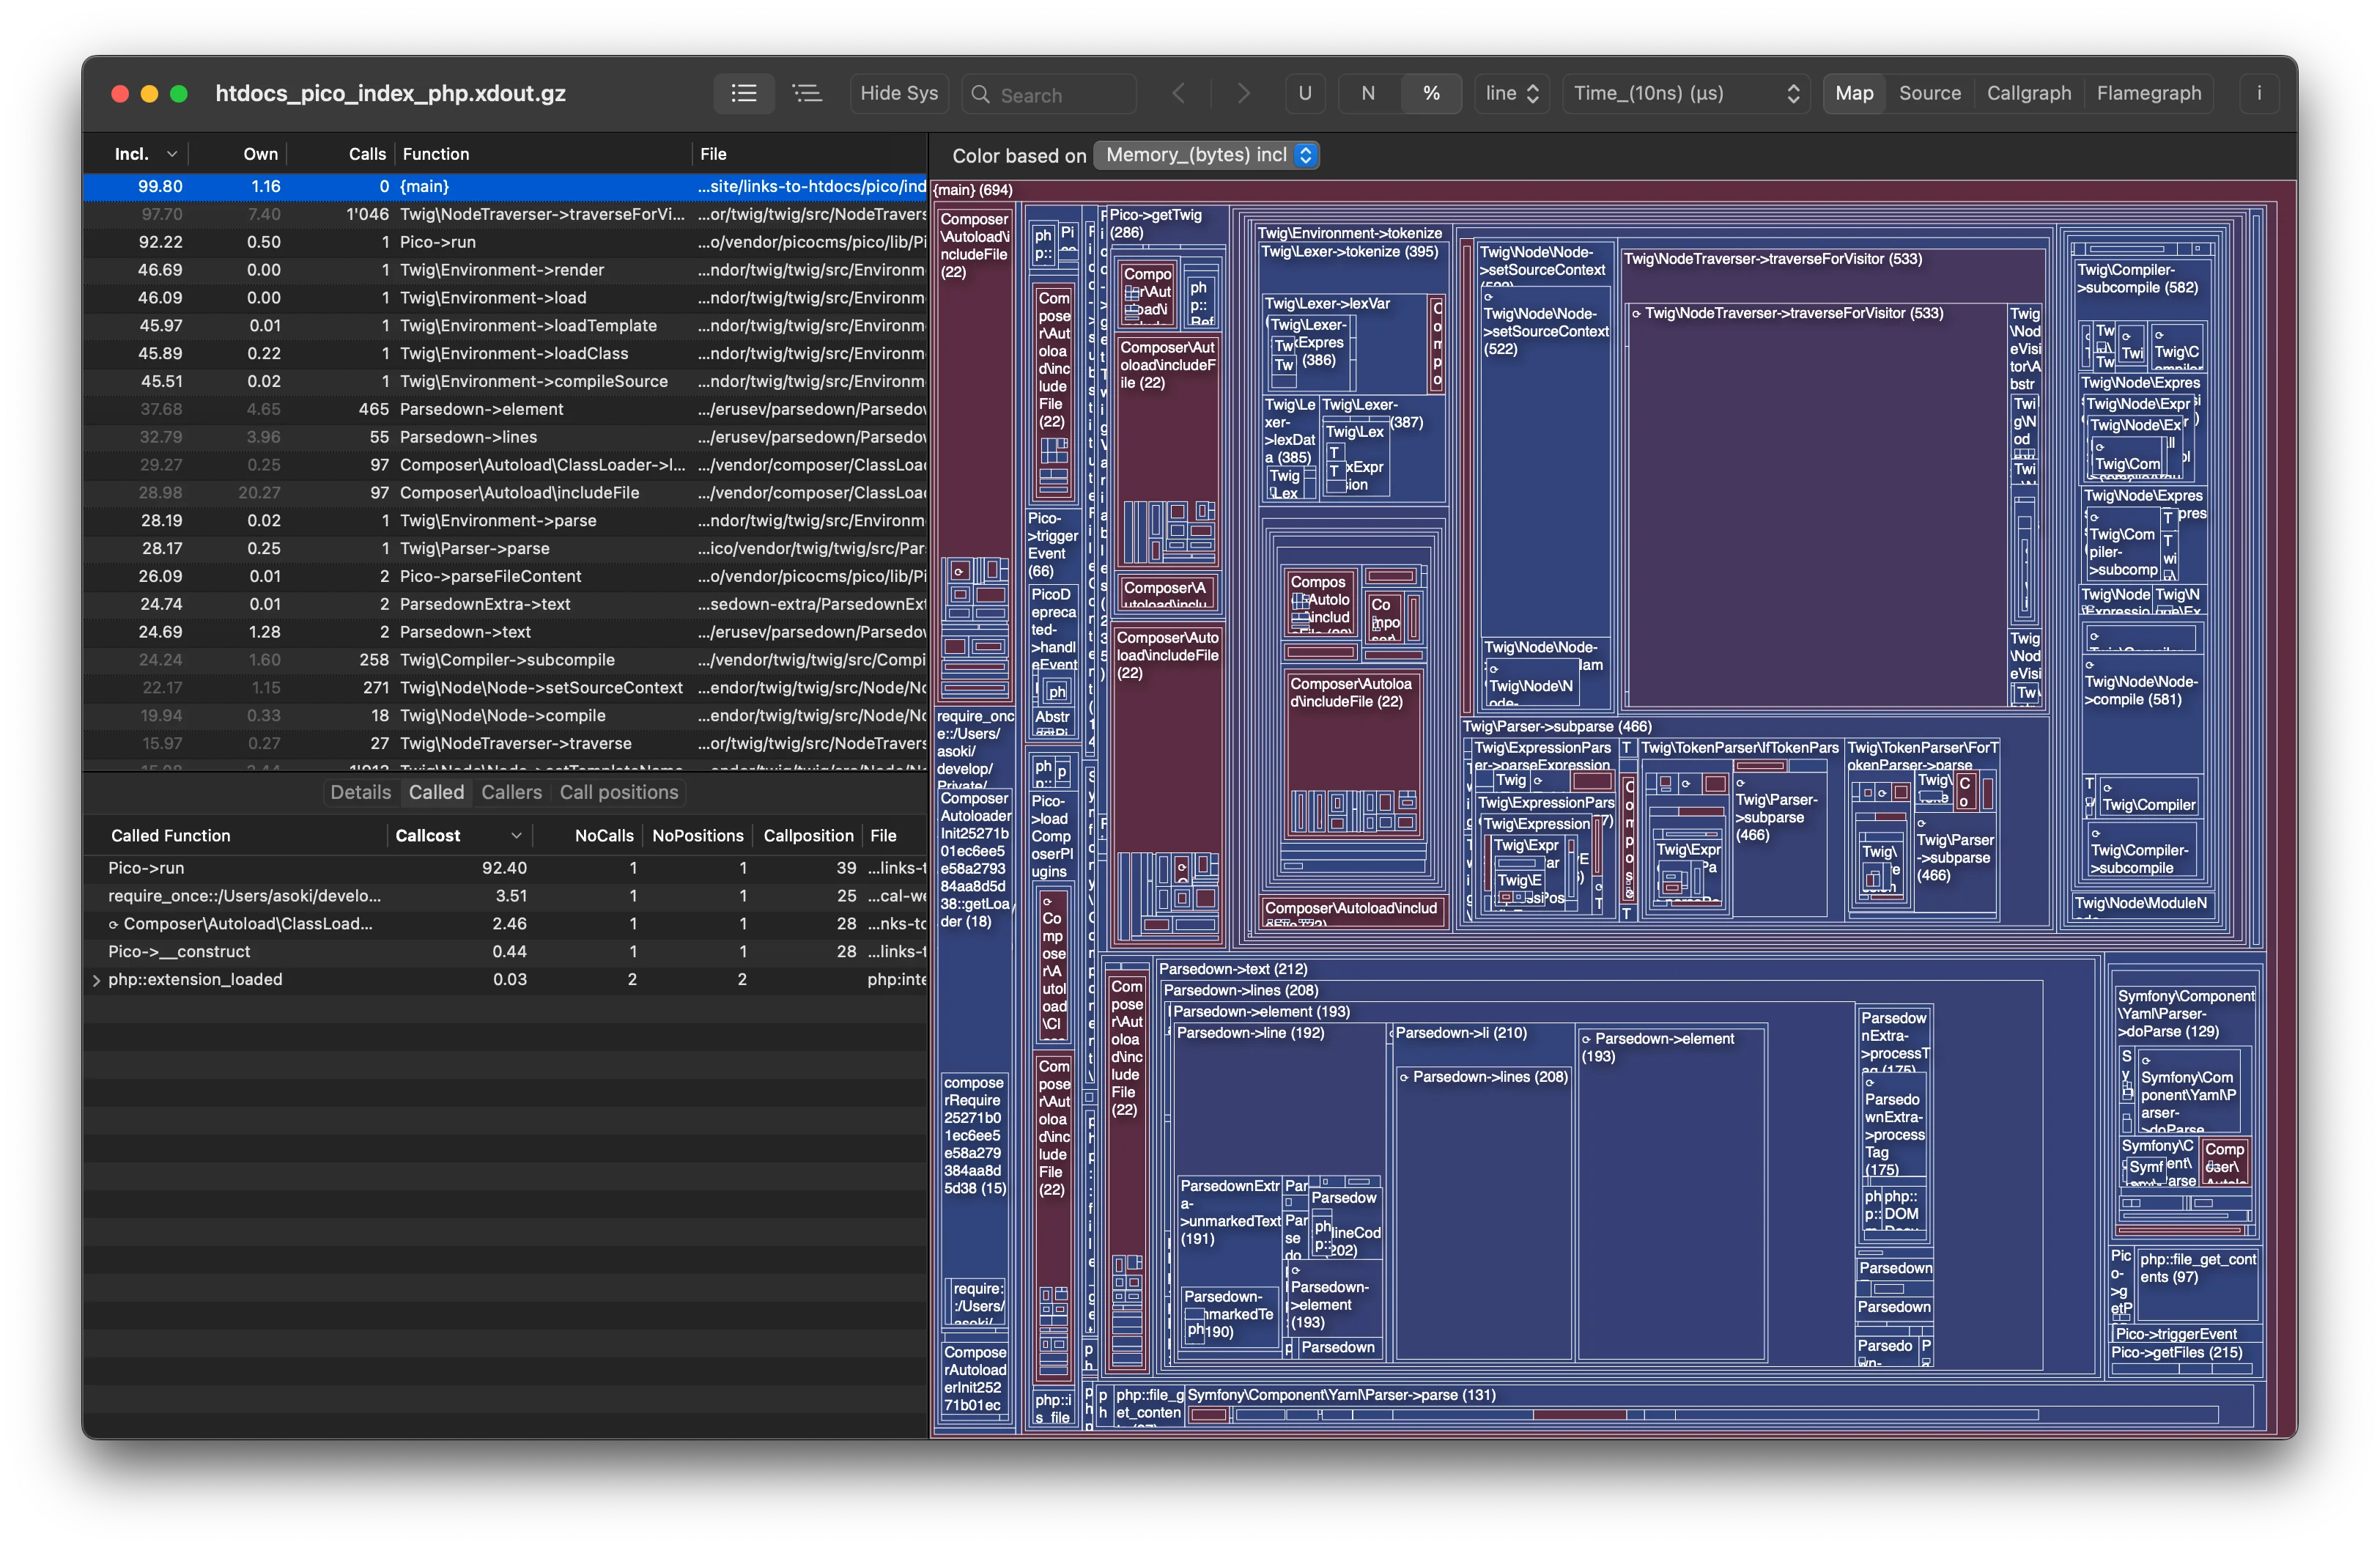
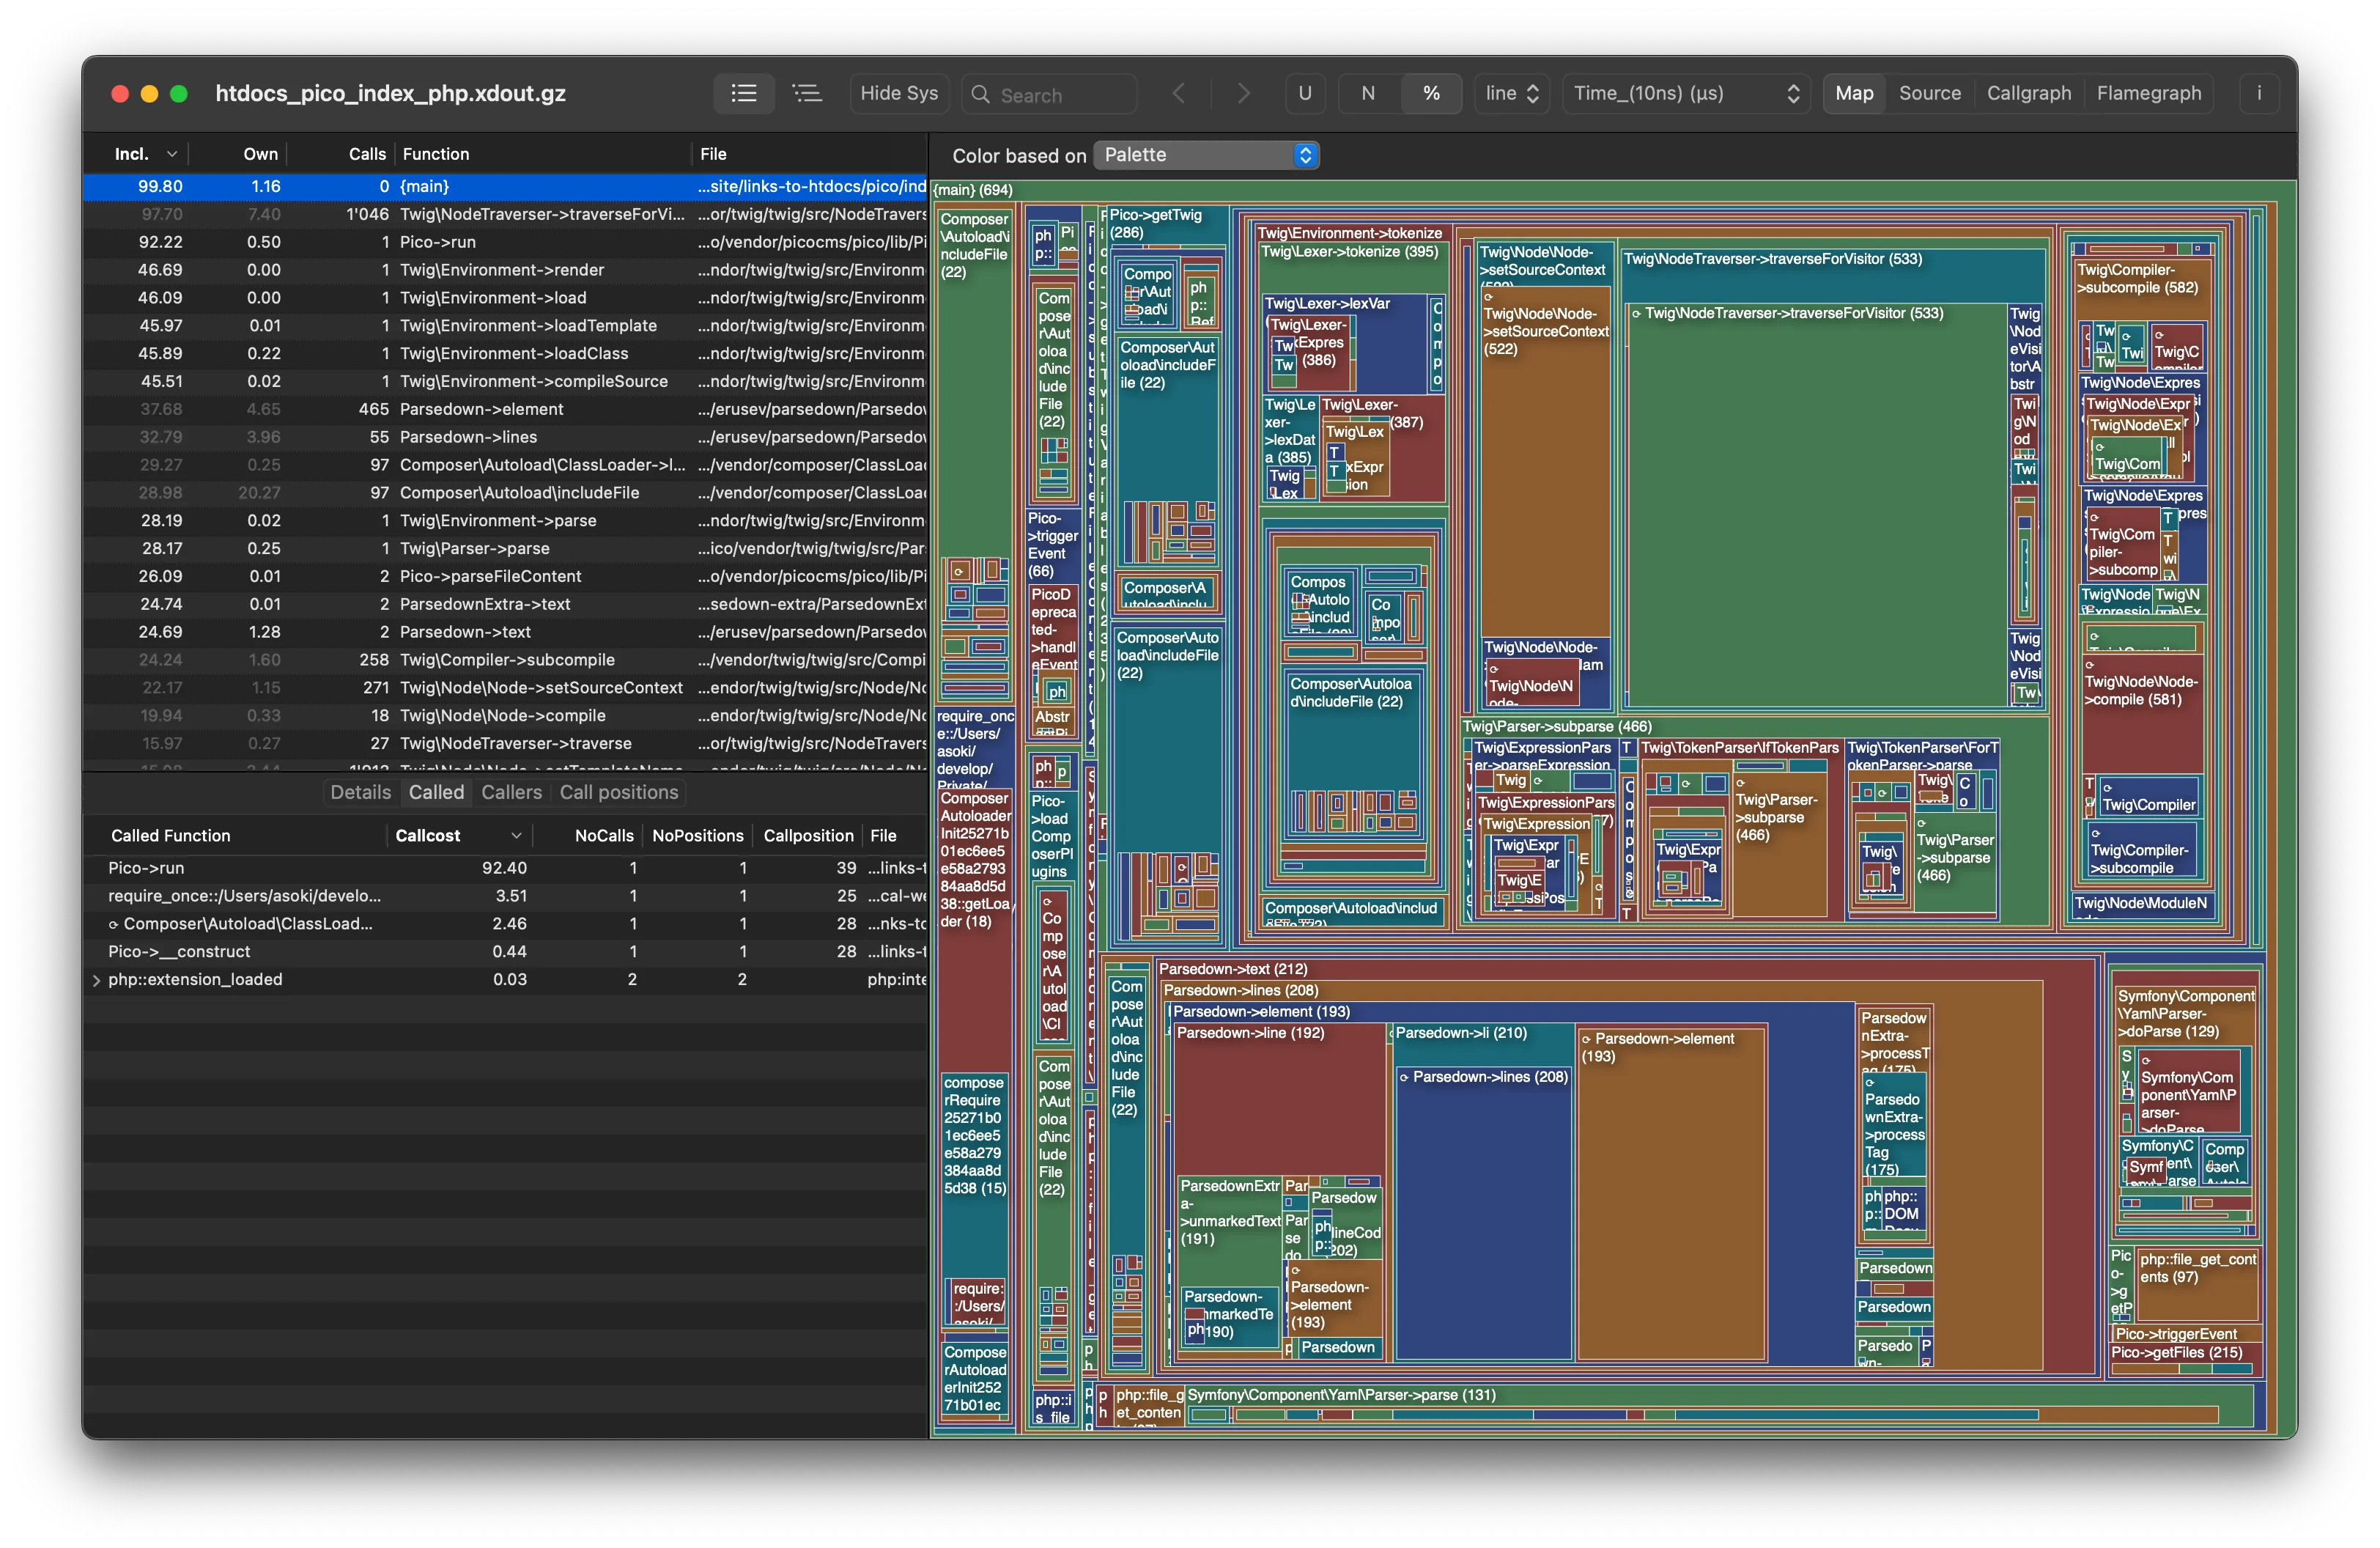
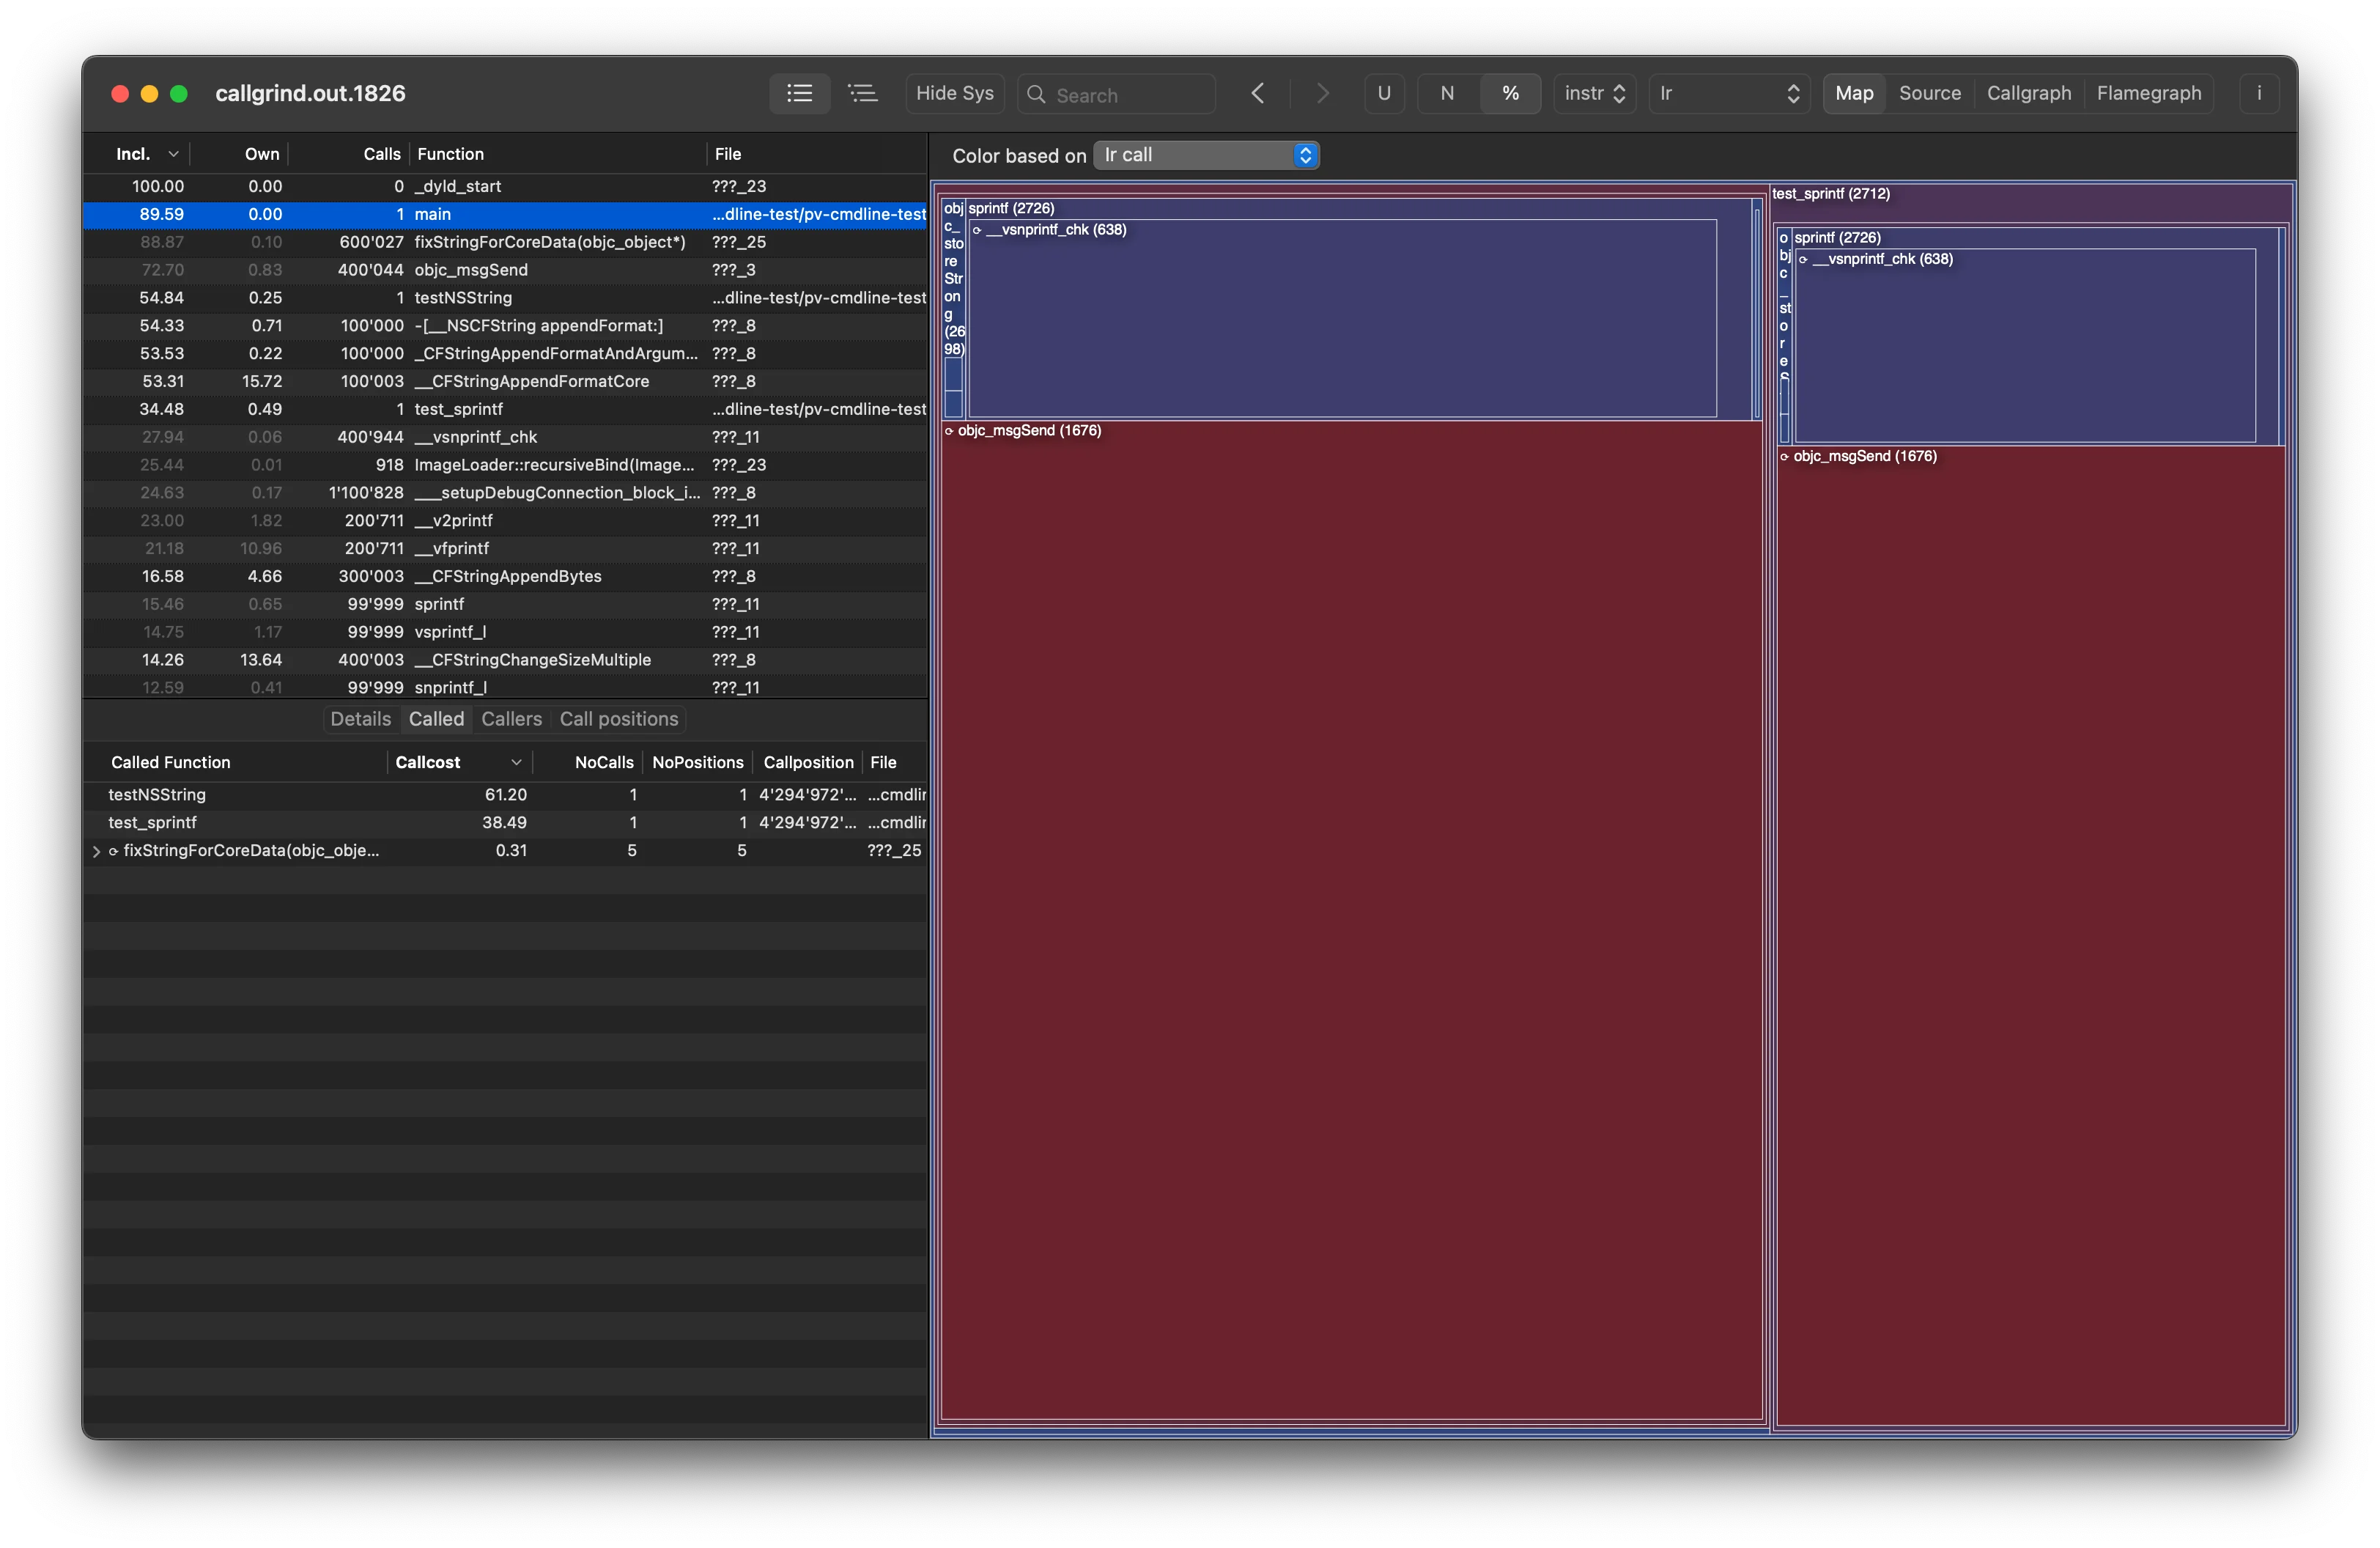
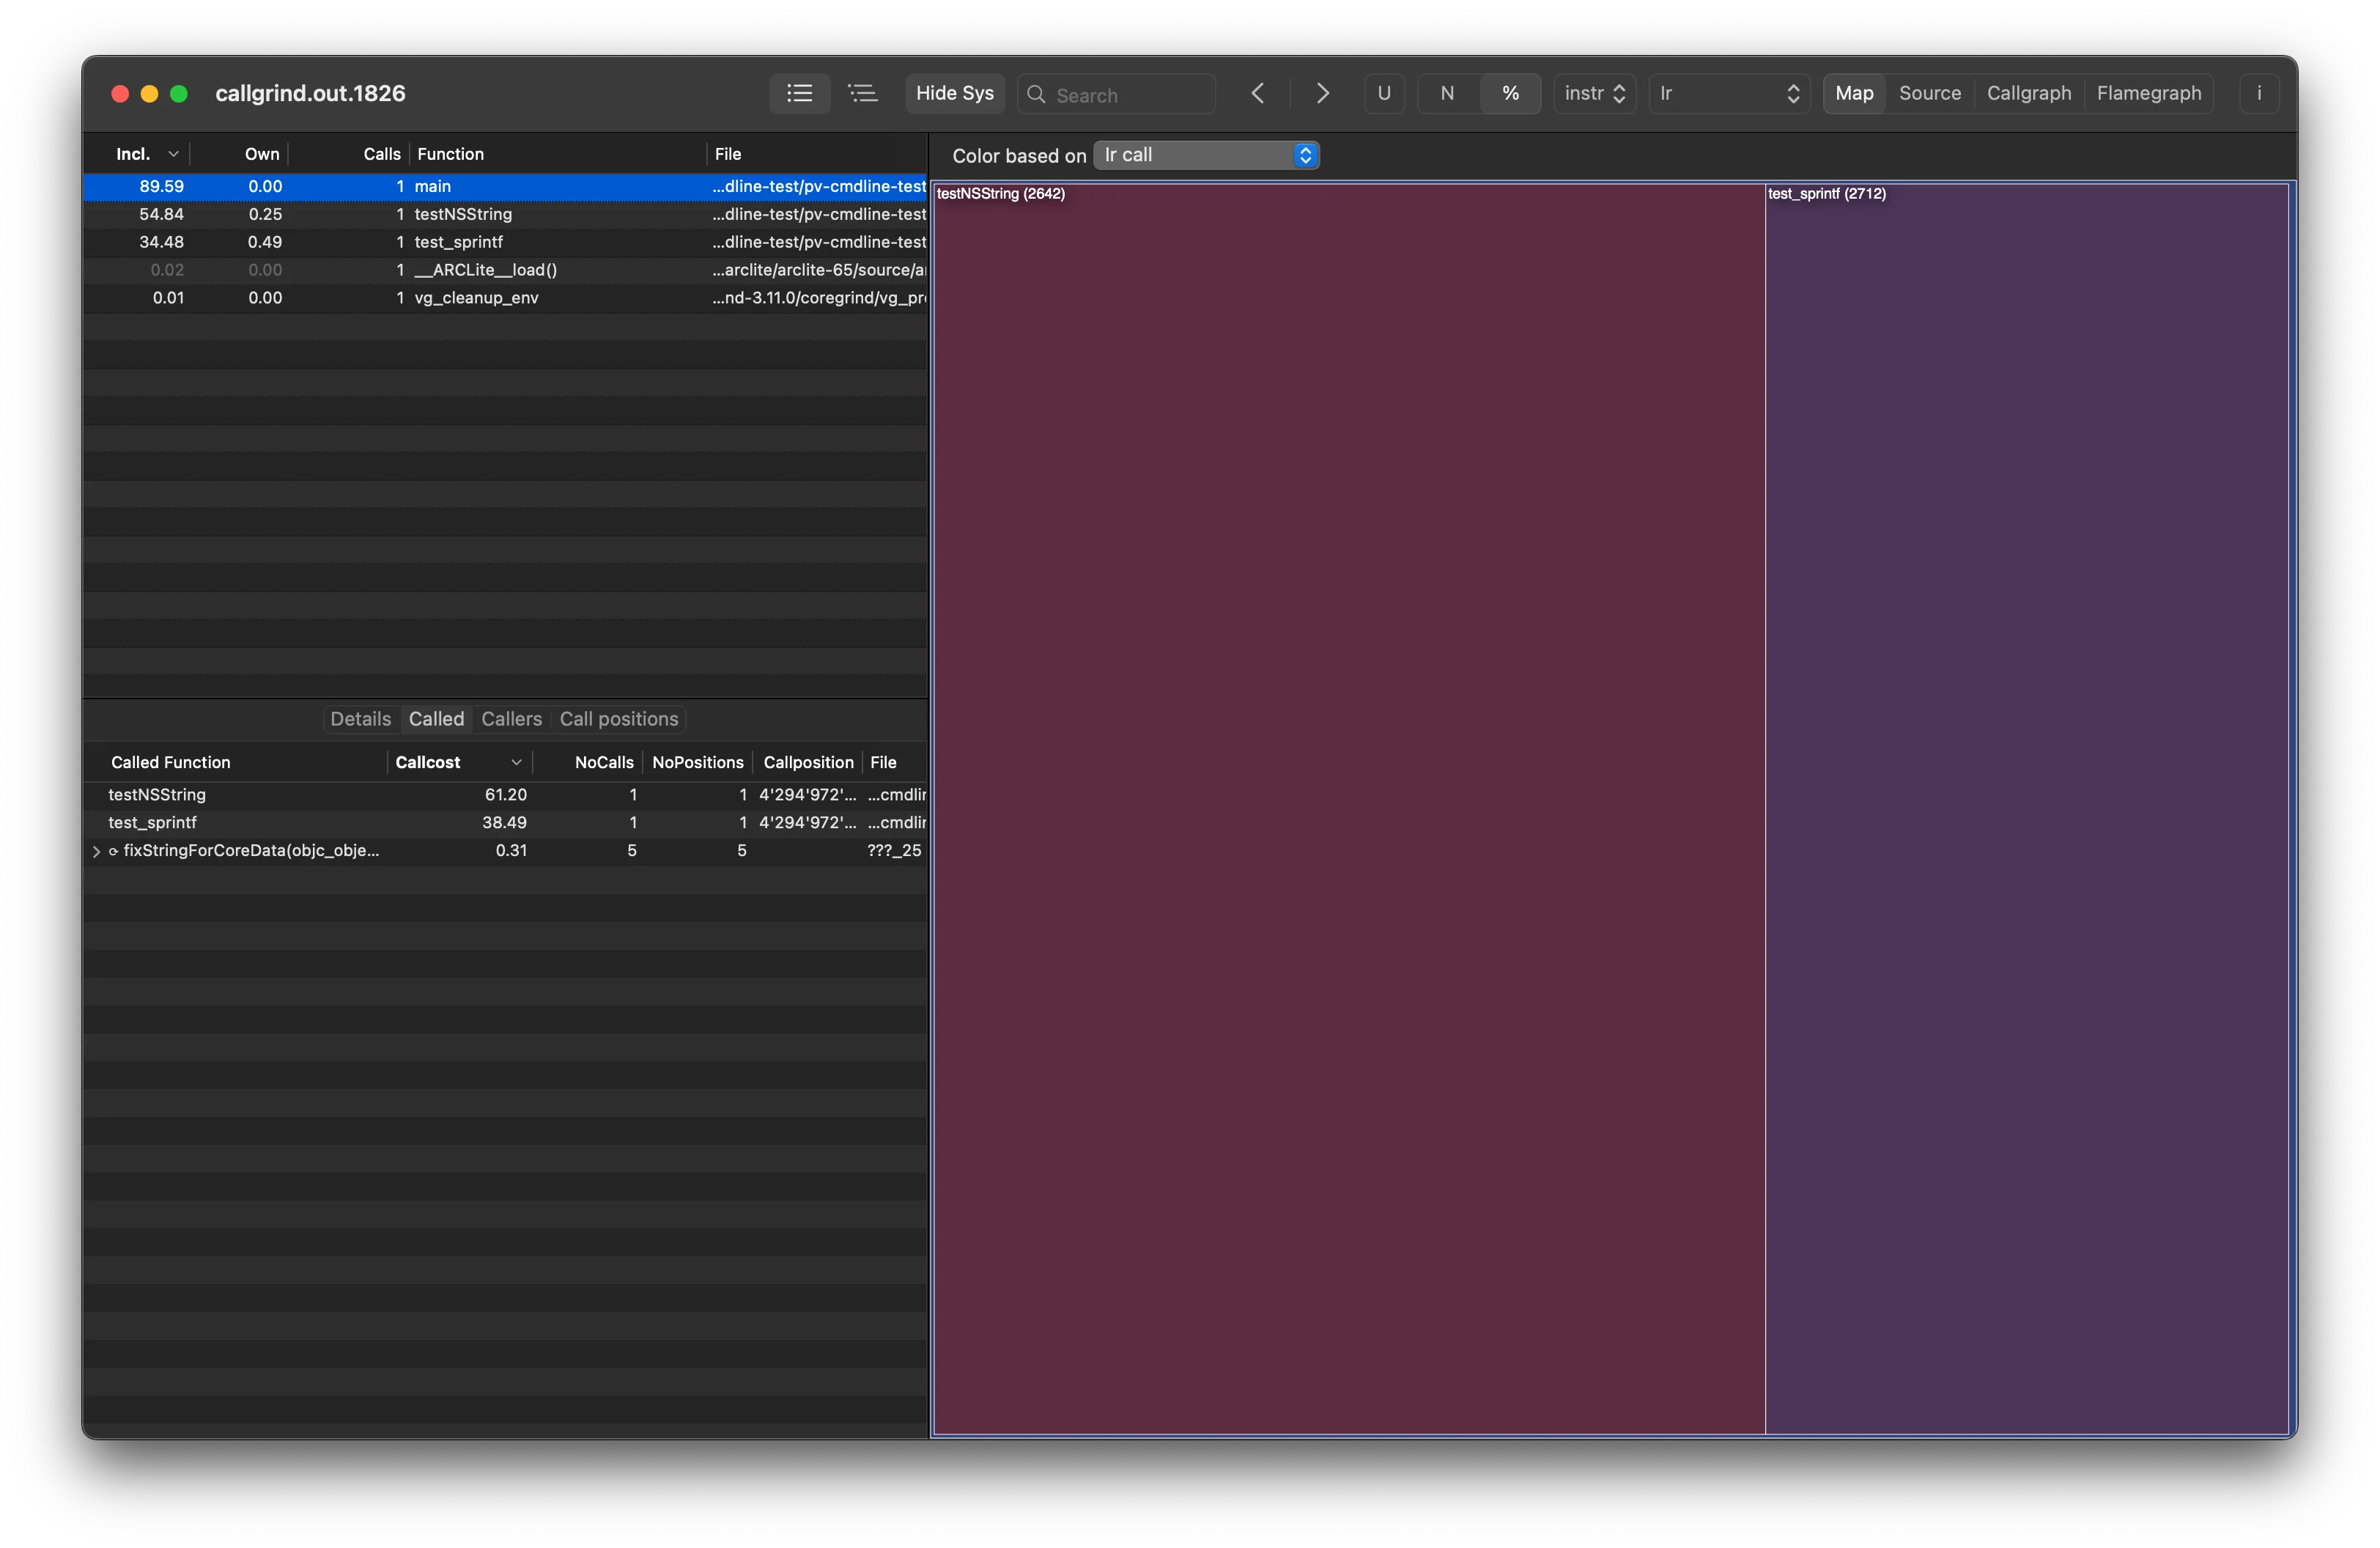
Treemap
Visualizing function costs as Treemap. The color scheme of the treemap is selectable between palette or heatmap. In heatmap mode, you can combine the main metrics with a secondary metrics. The main metrics (e.g., Time) determines the size of the areas, while the secondary metrics, such as call count or any other available cost, determines the color of the areas in the heatmap.
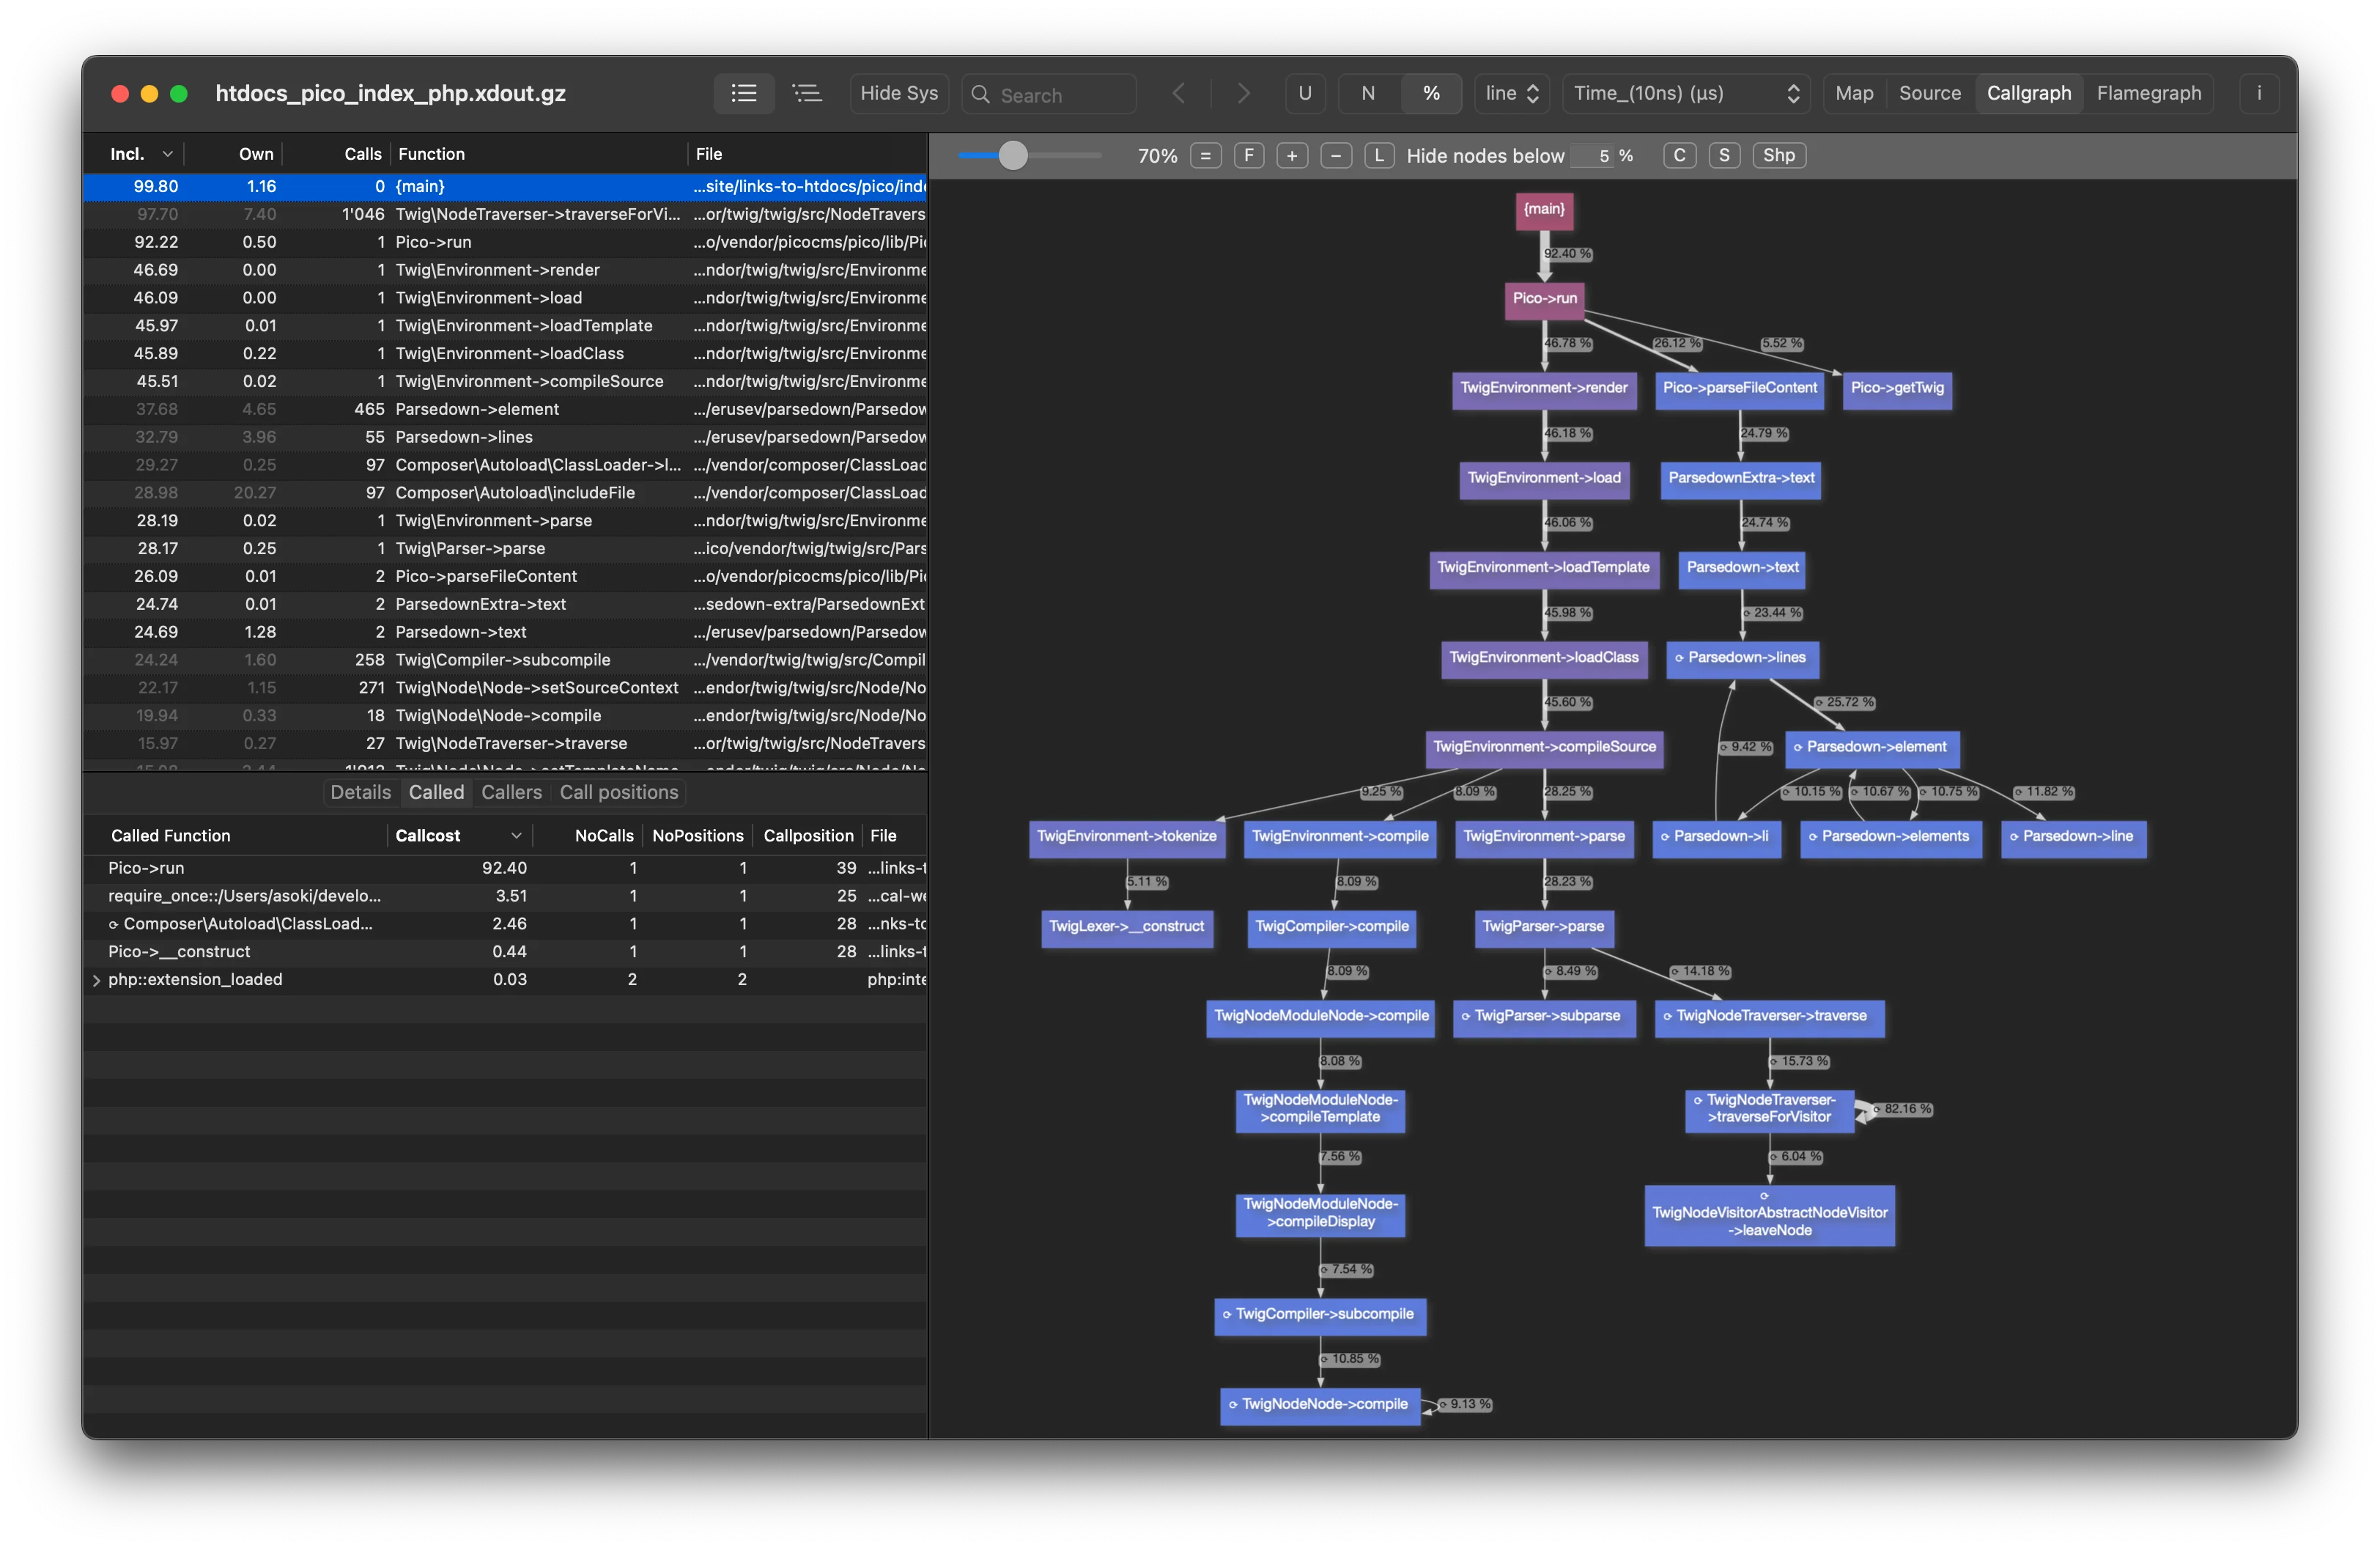
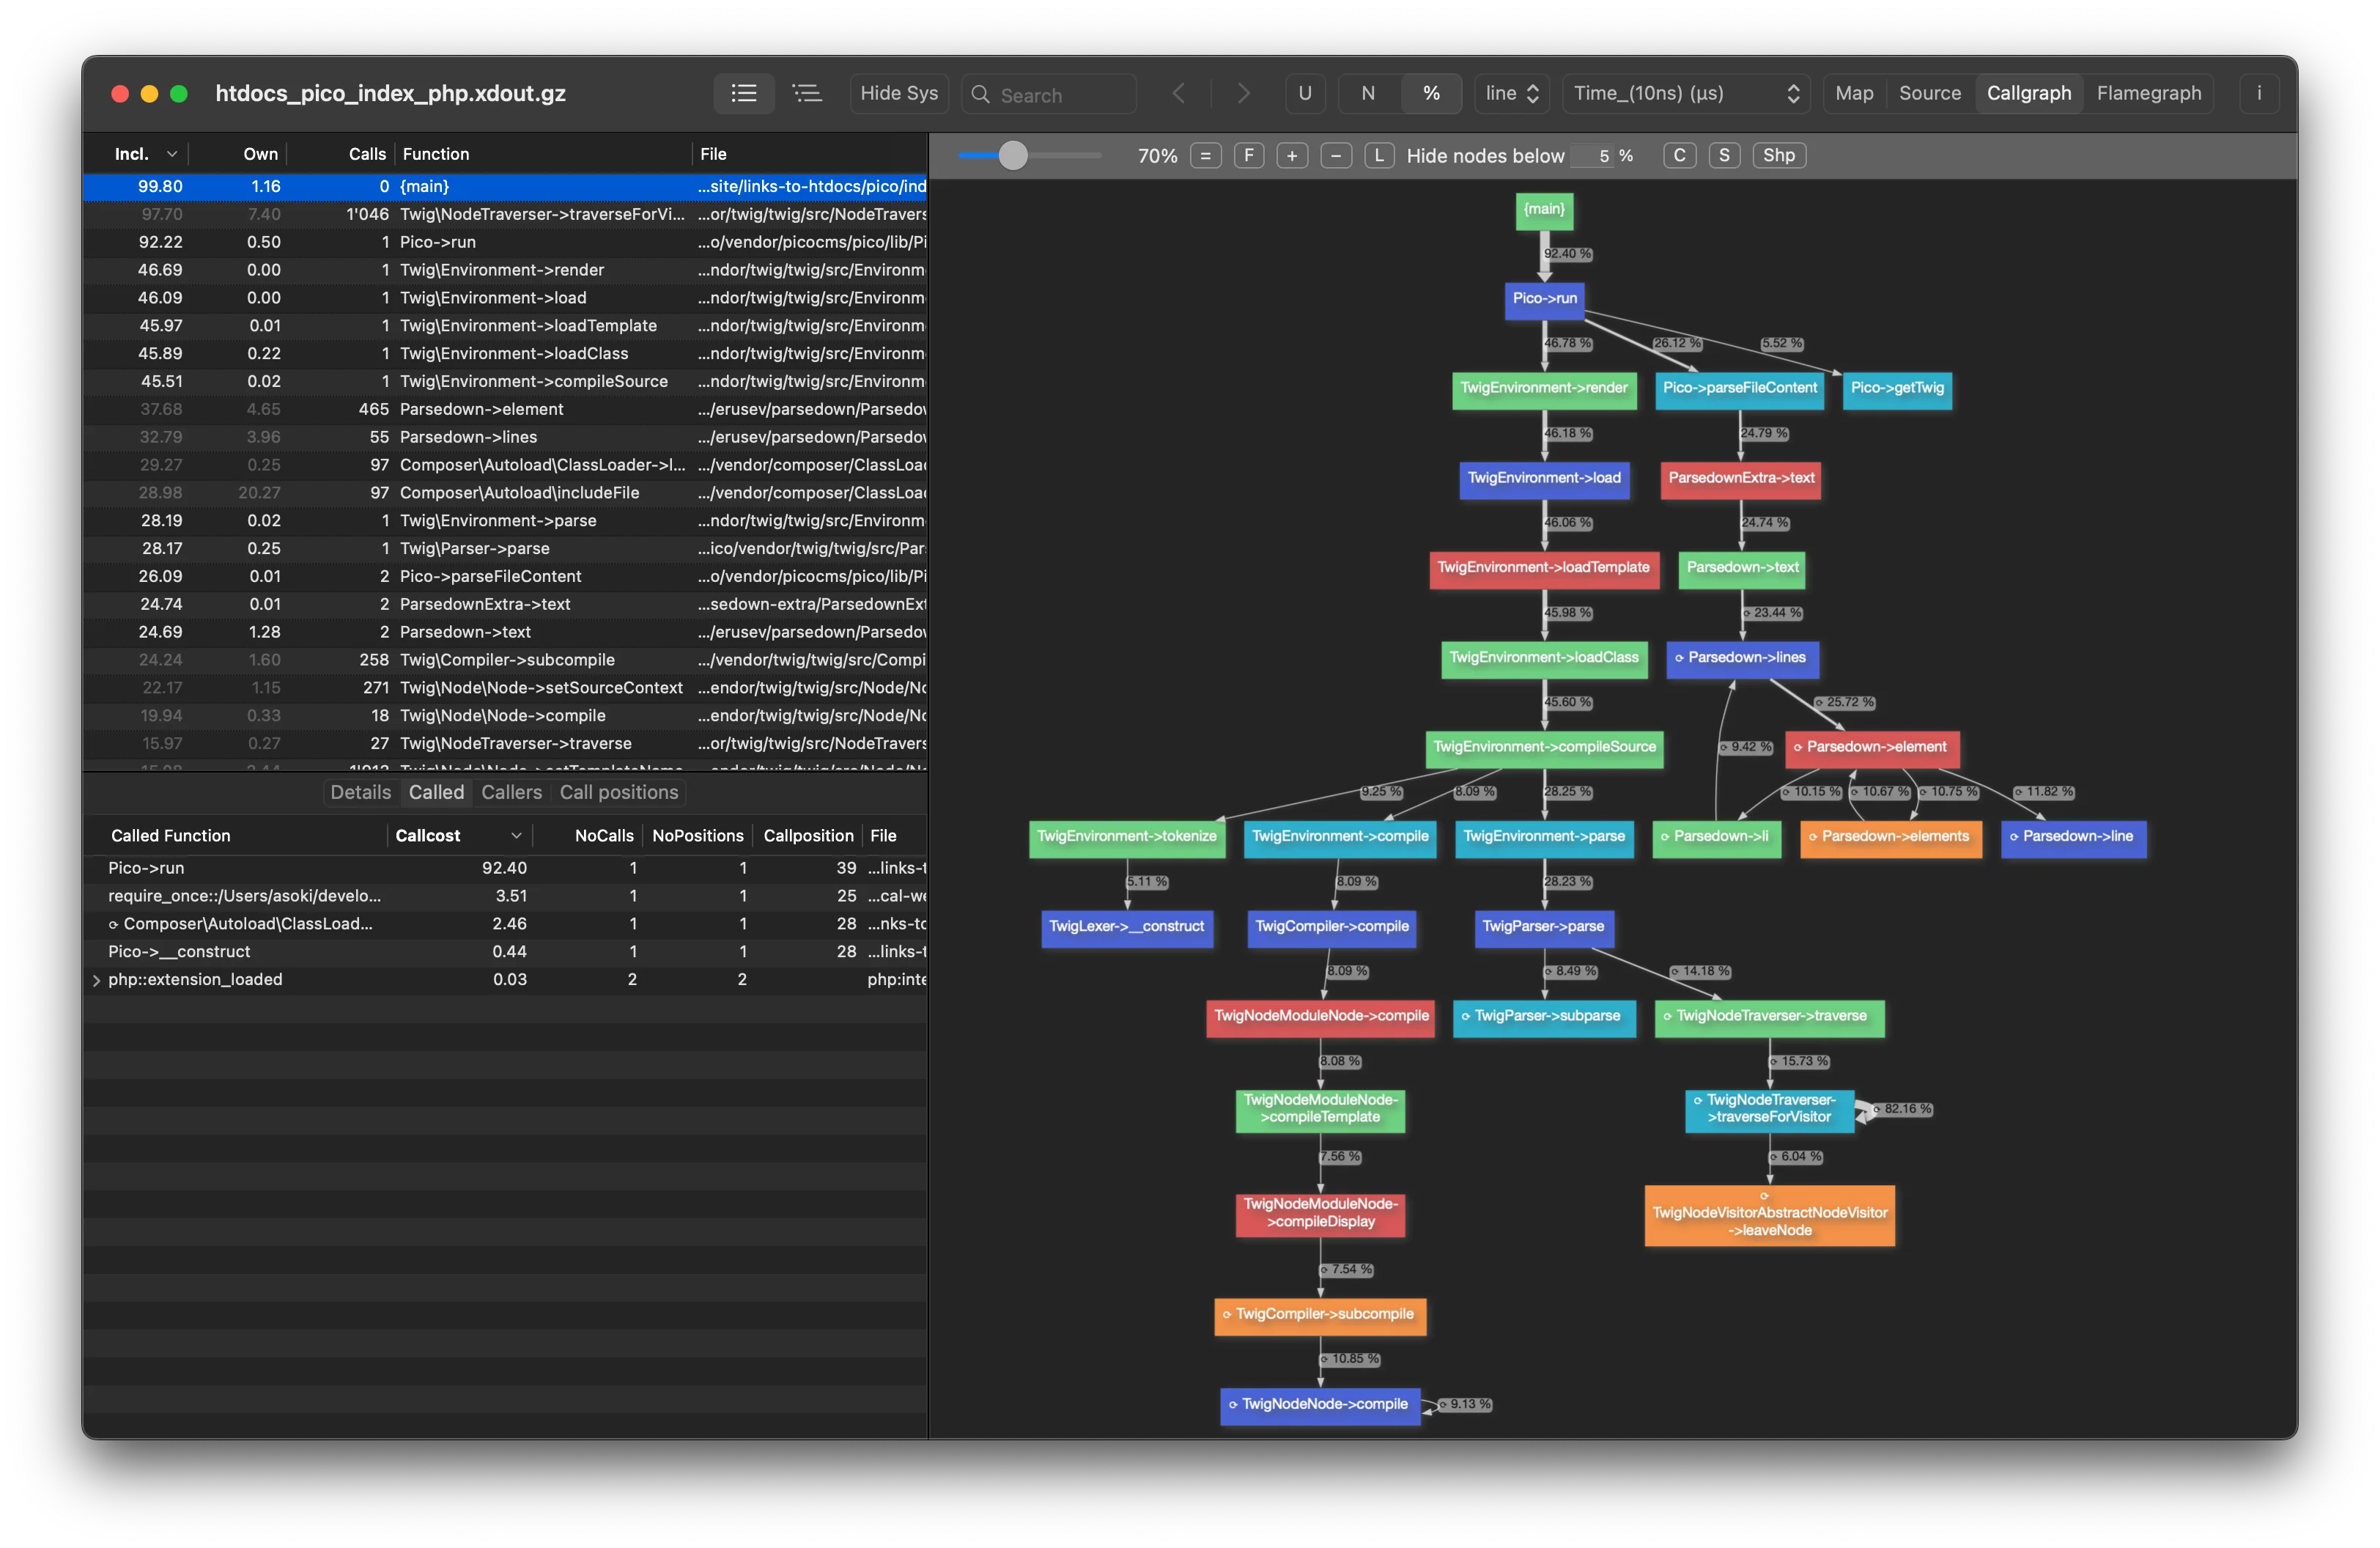
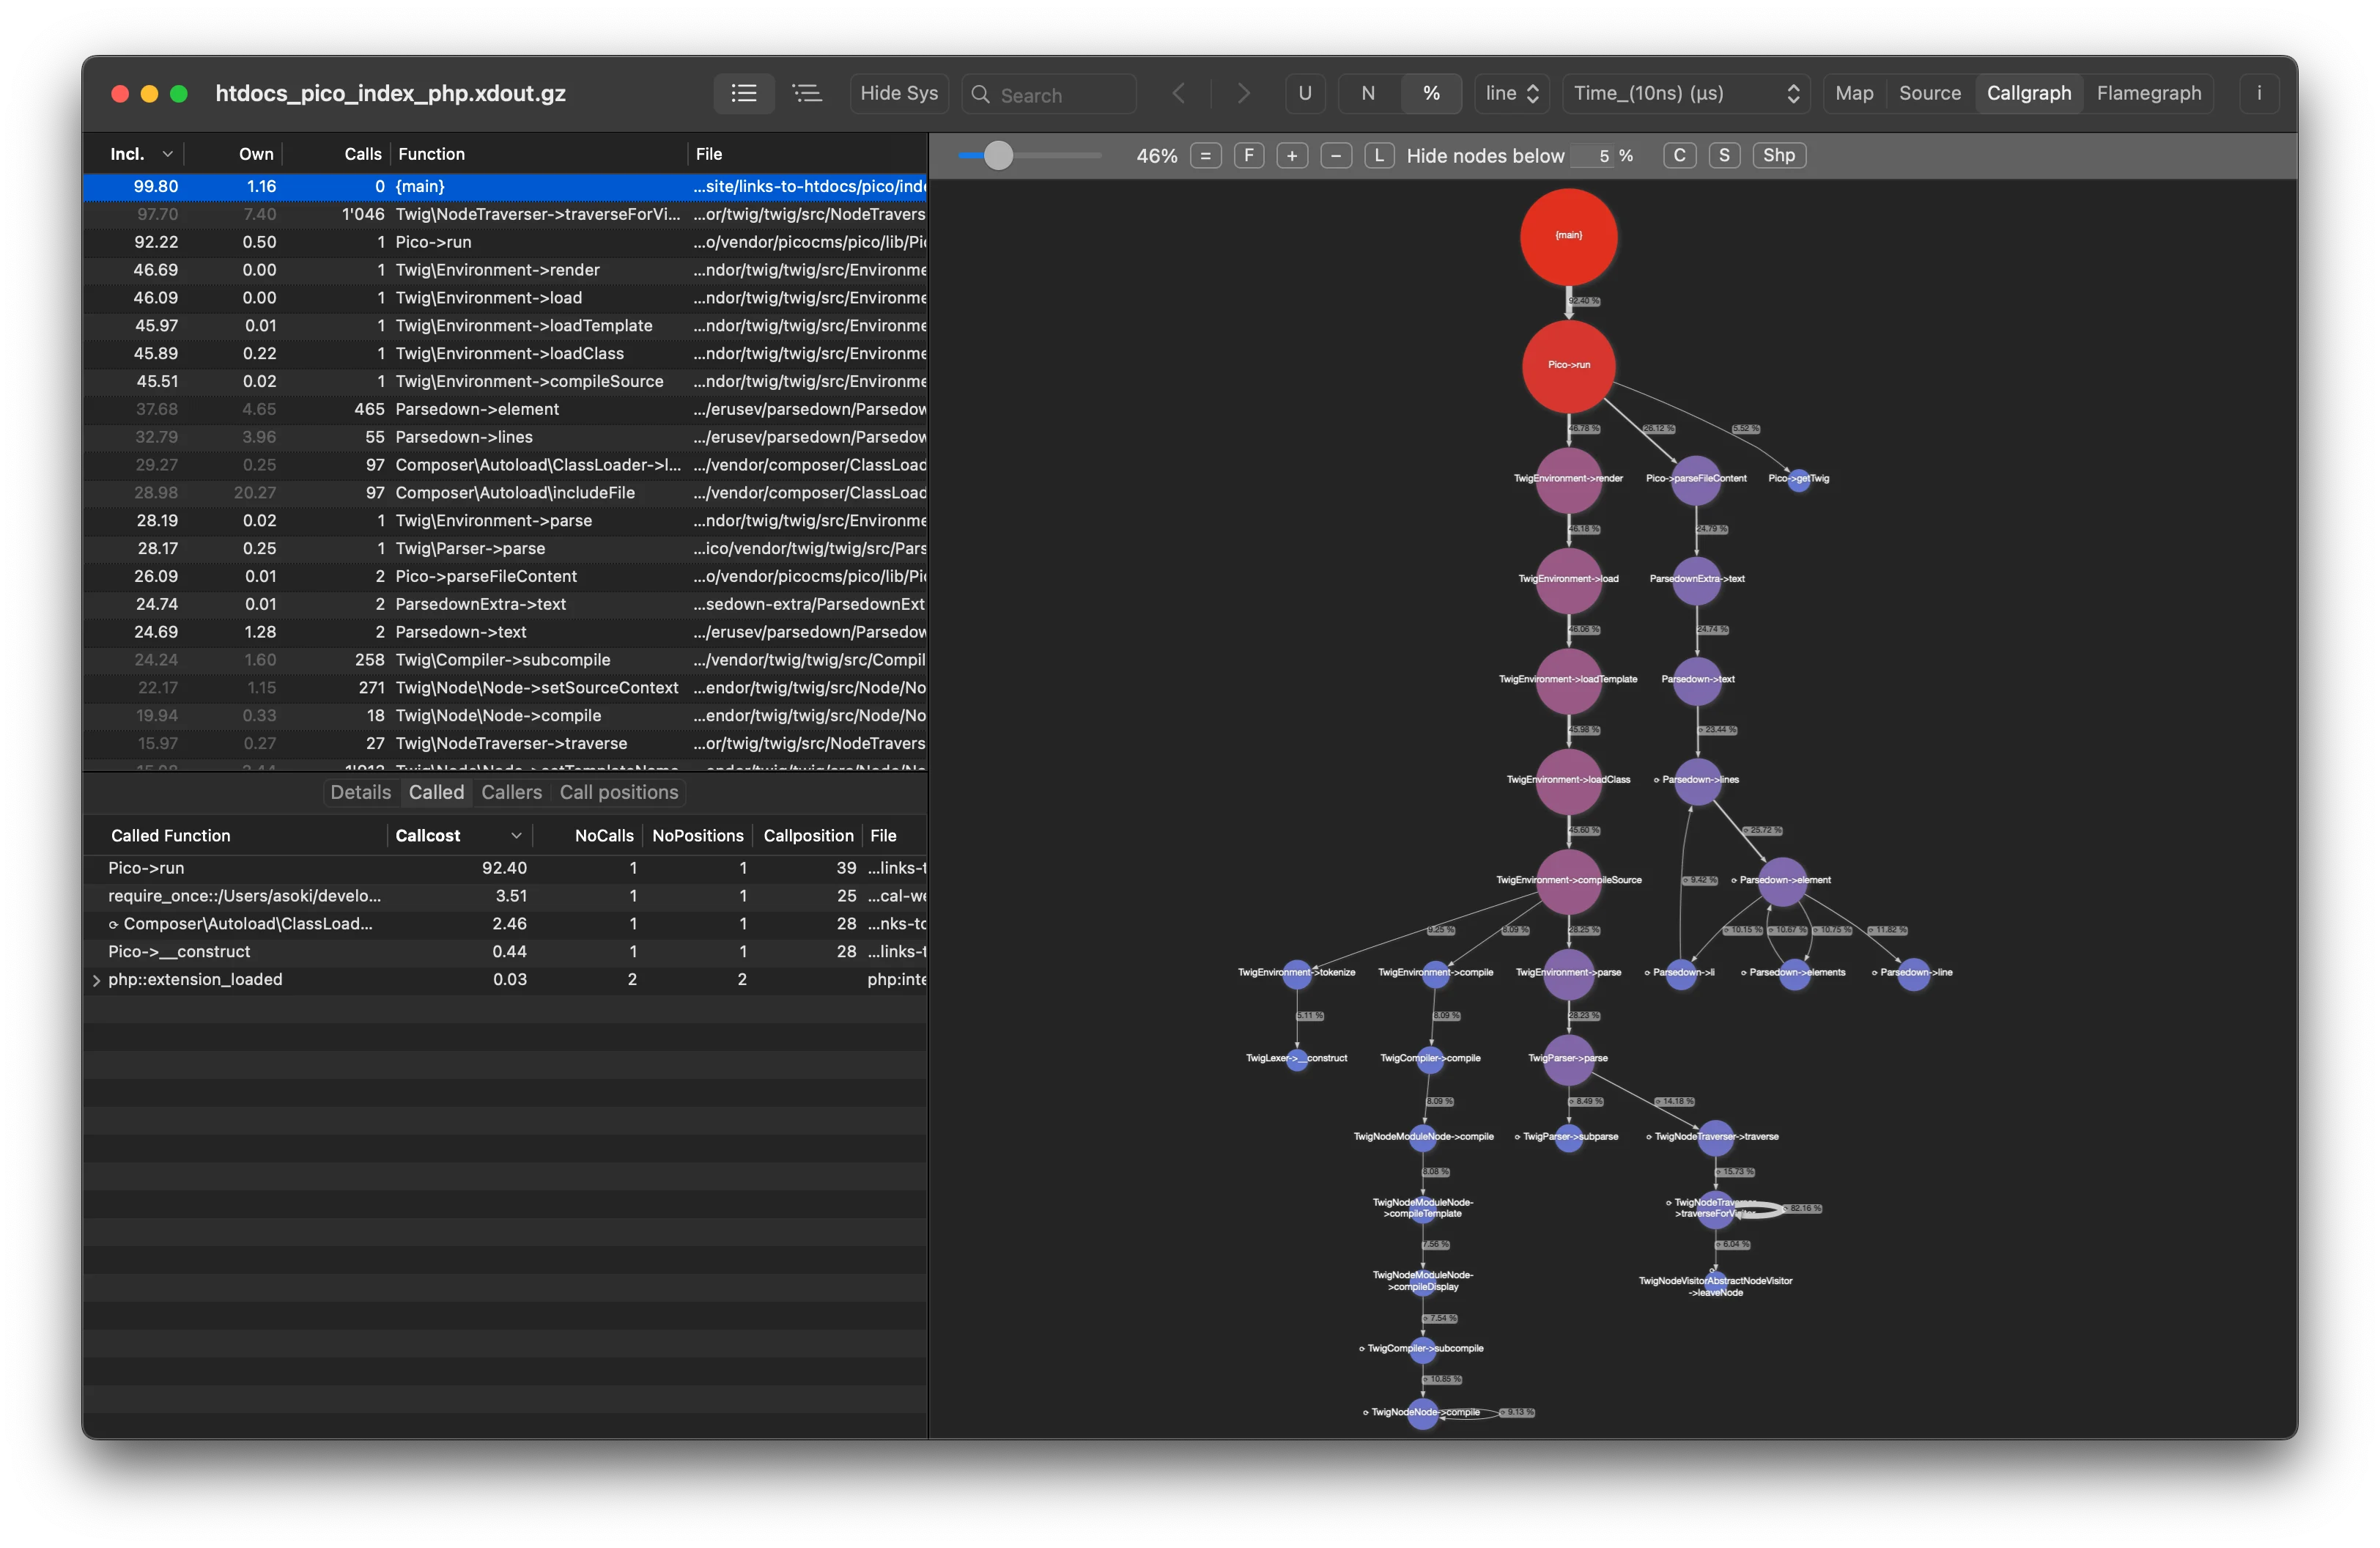
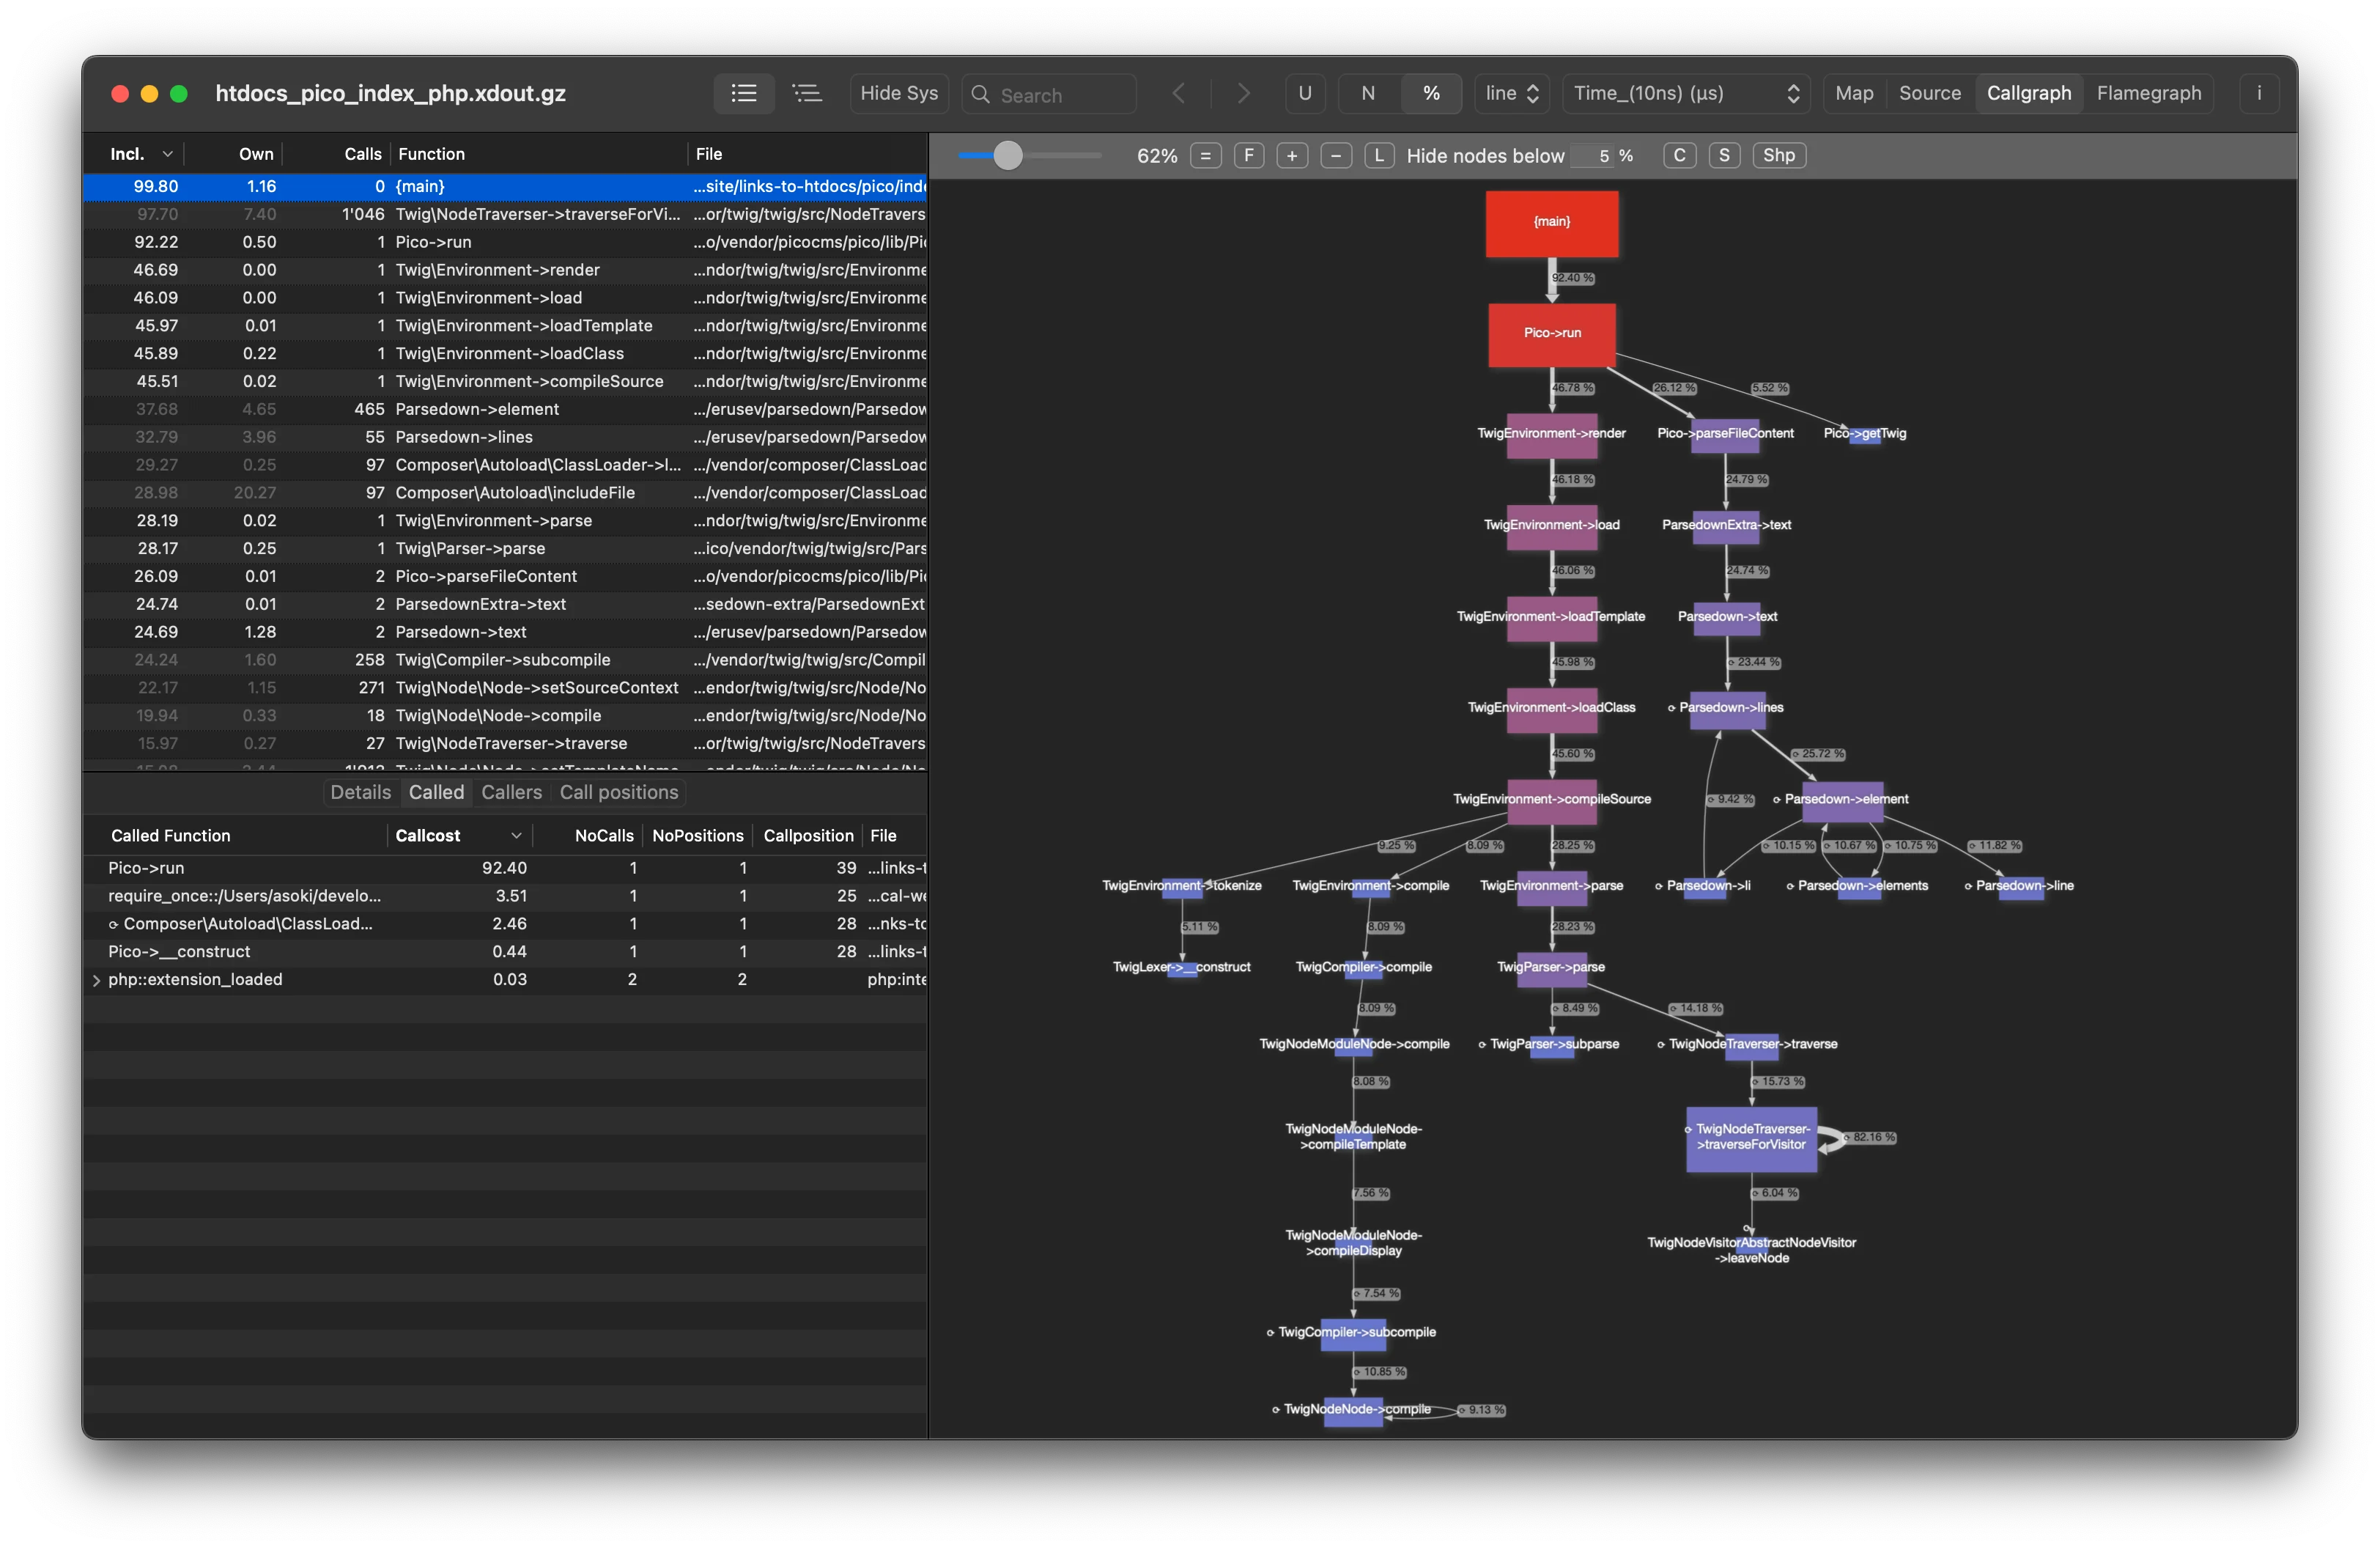
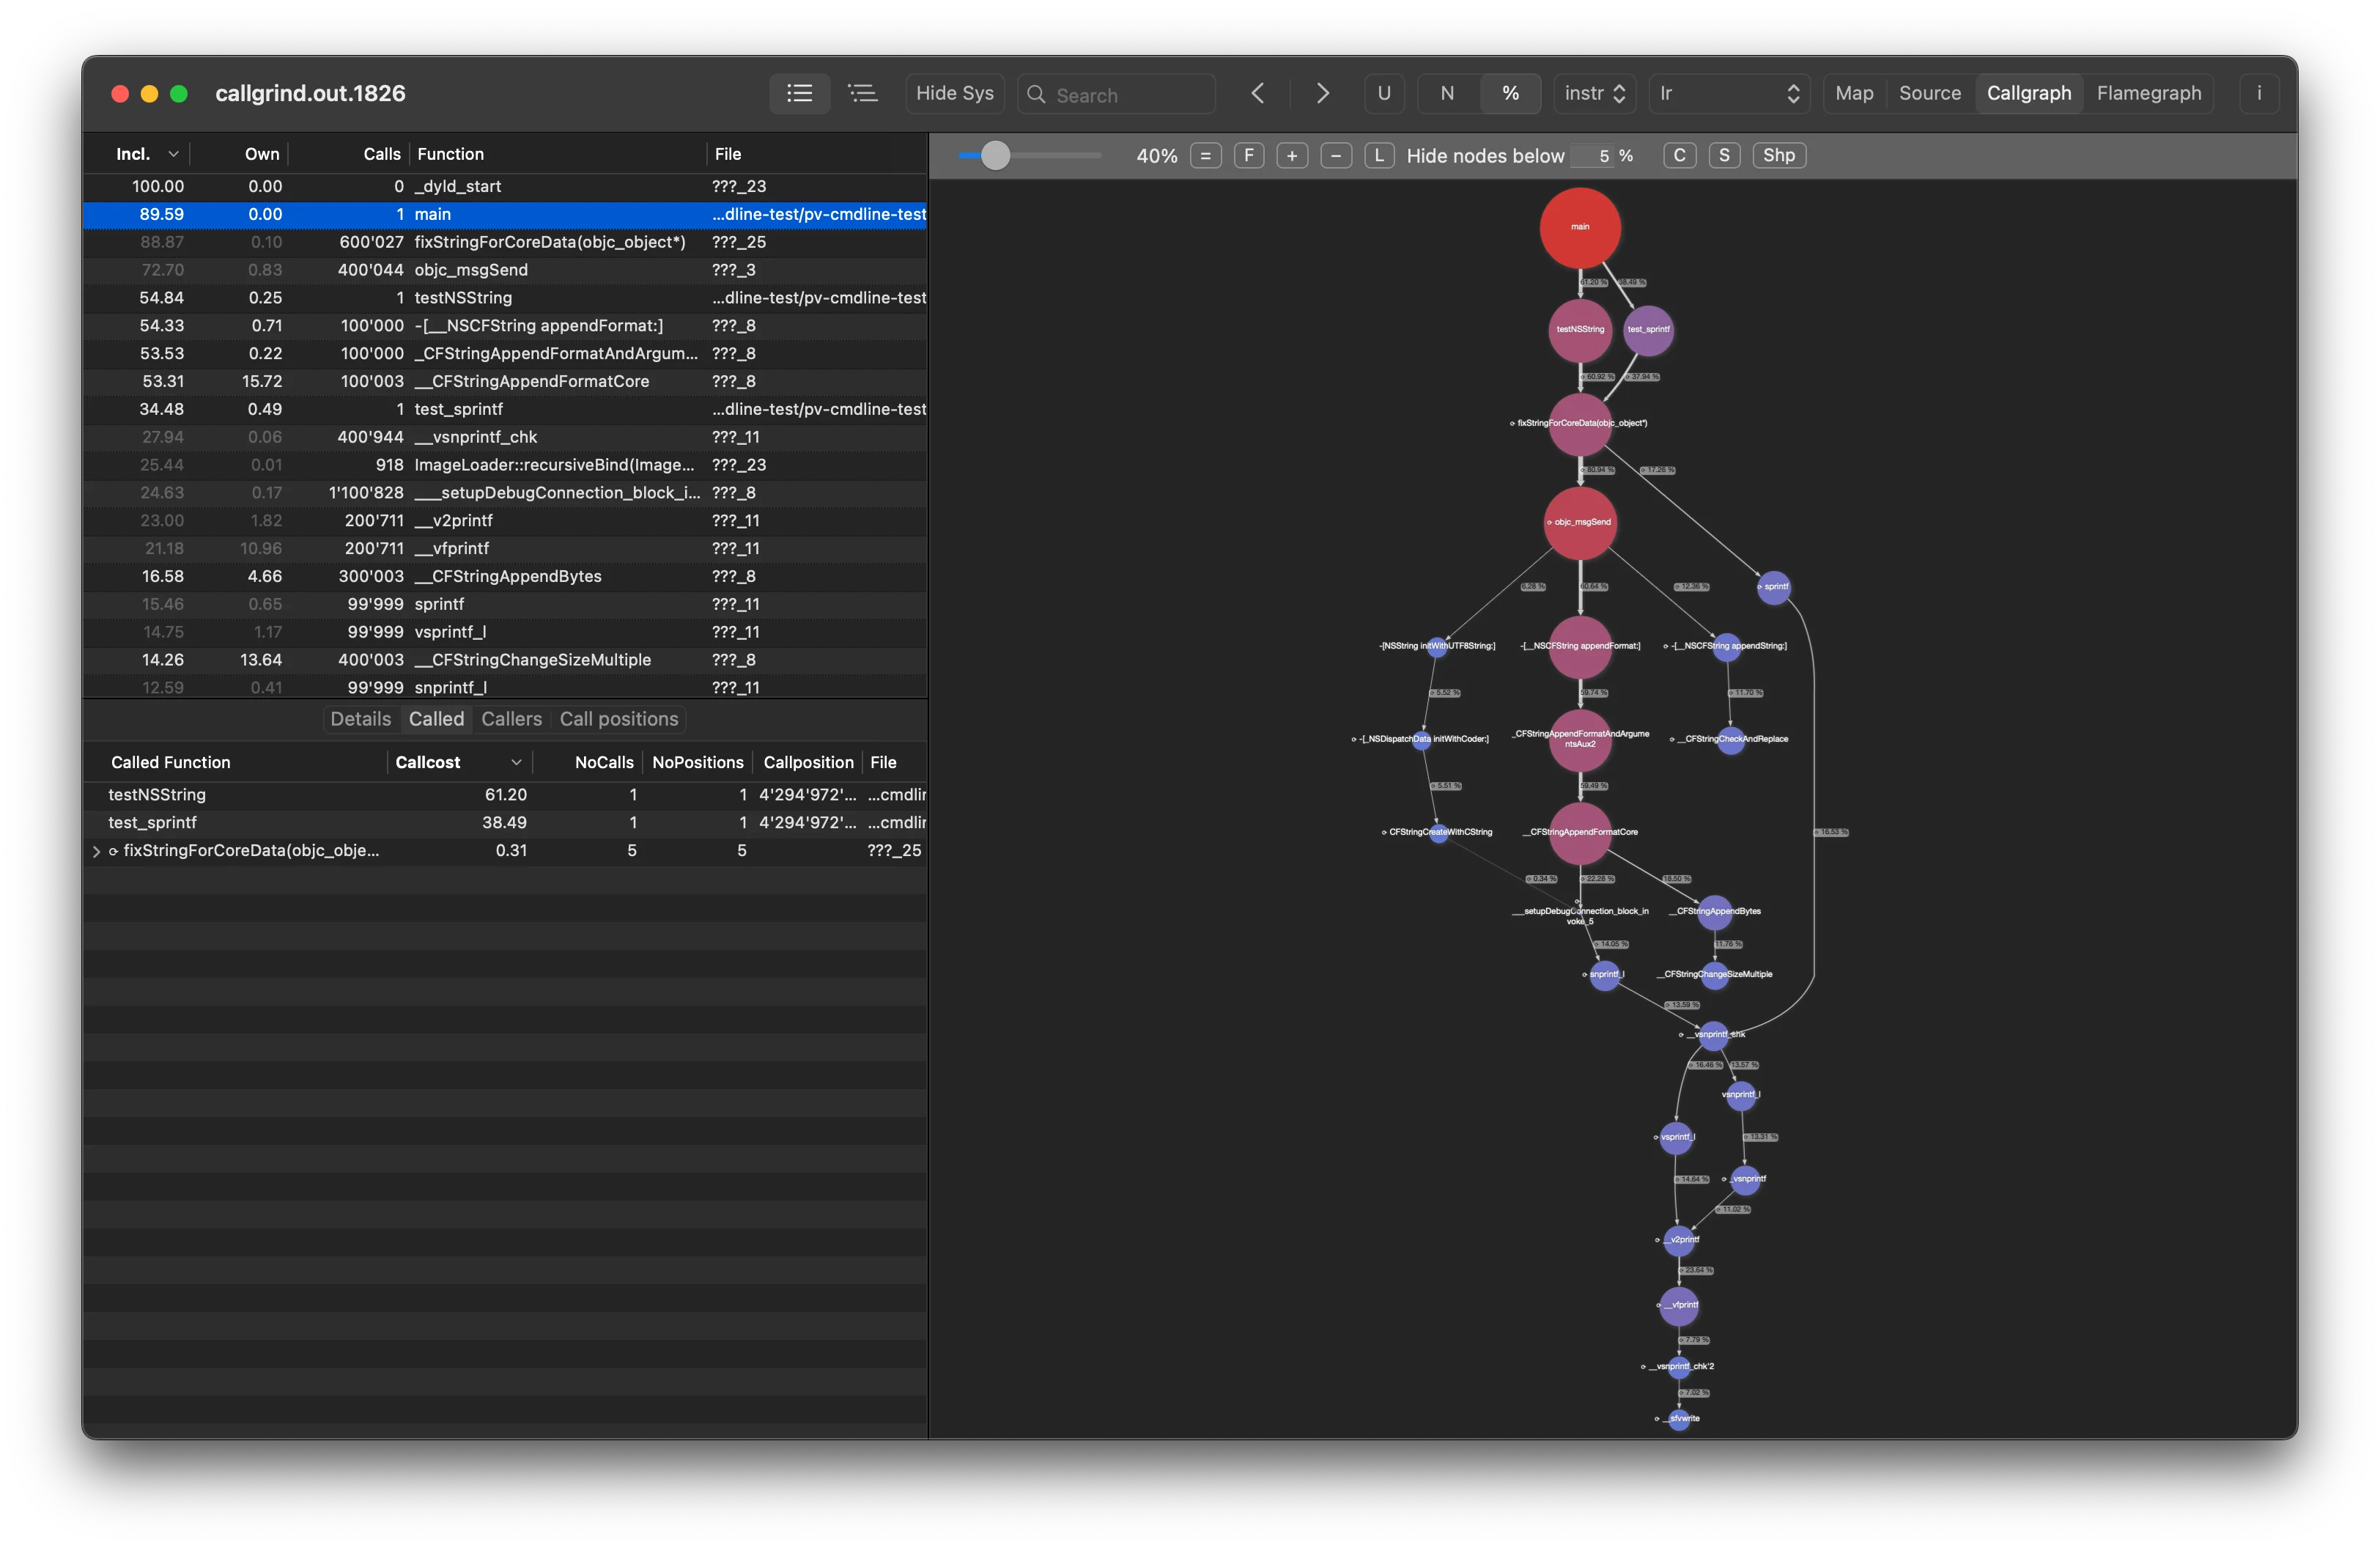
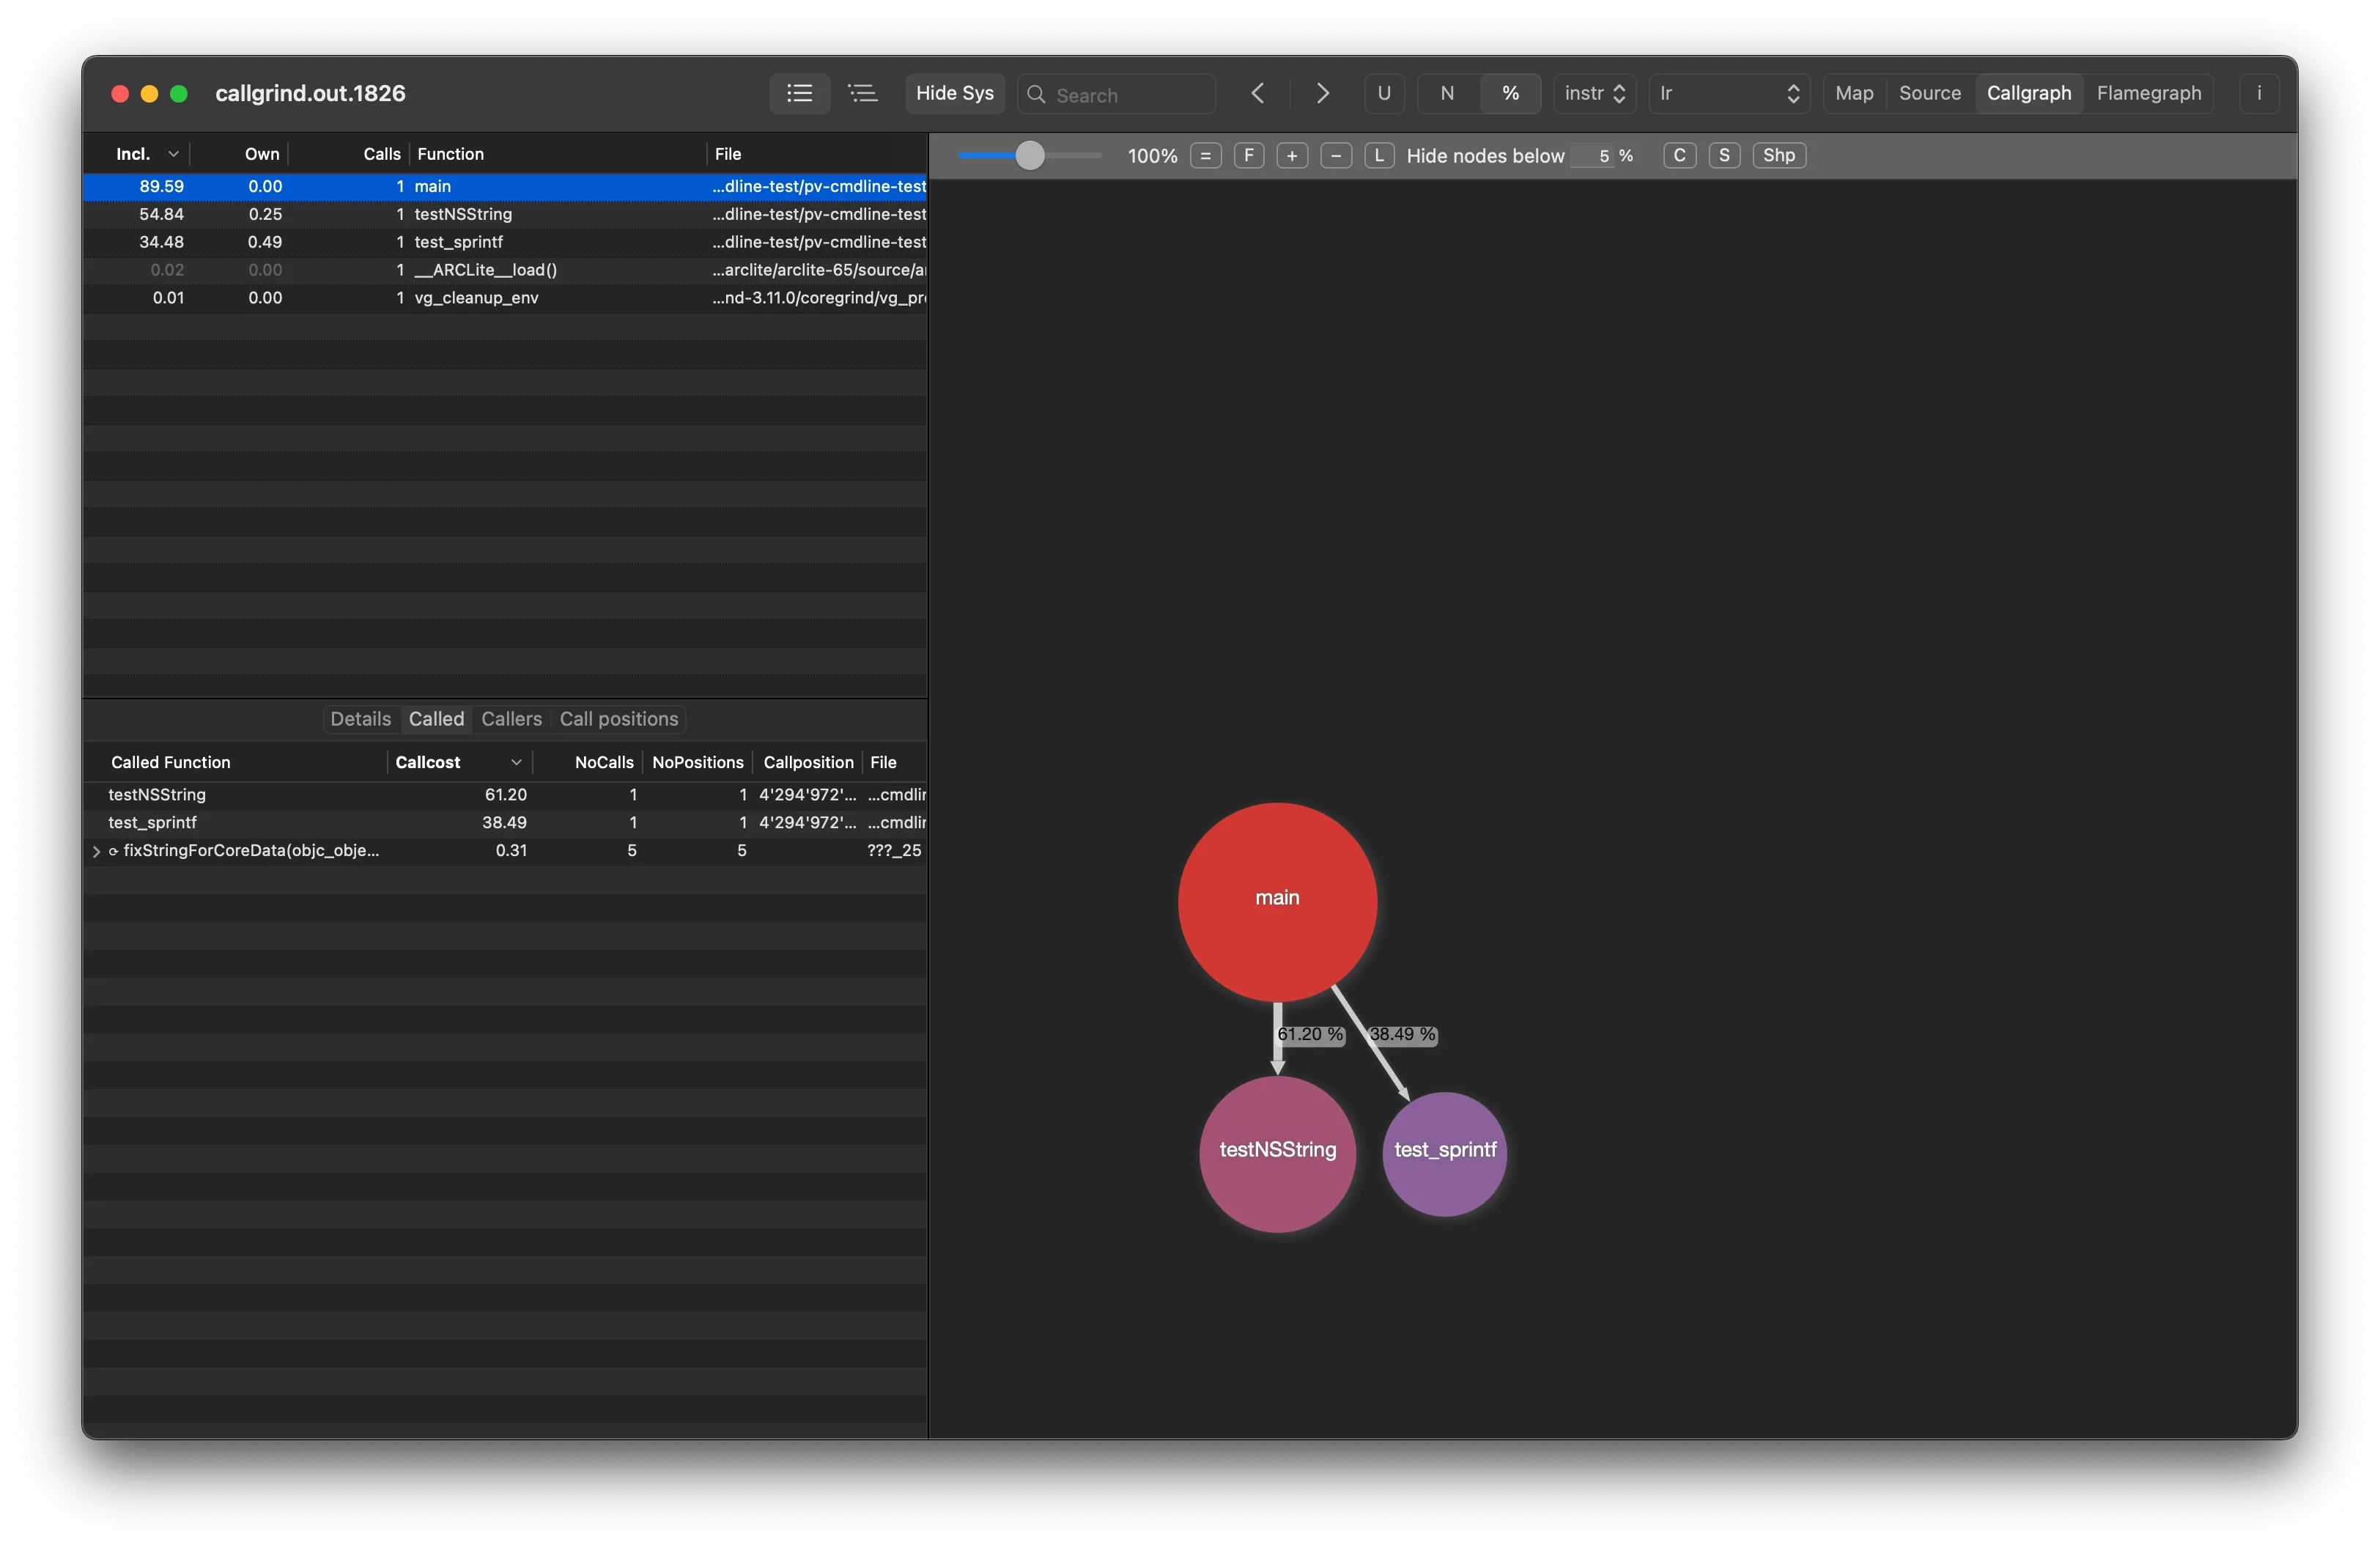
Callgraph
Visualizing function costs as Callgraph. You can combine up to three metrics to build the callgraph. The primary metrics (such as time) determines which functions will be displayed and is represented by the thickness of the connections between nodes. You can use either callcount or any other available cost to control the color (heatmap) and the area (size) of the call graph nodes. The callgraph complexity can be reduced by hiding functions with costs below a customizable preset. The node shape can also be customized to suit your preferences.
Additionally, the callgraph is interactive and supports trackpad gestures for zooming in and out, as well as smart zoom functionality. You can gain more detailed information by performing a double-click or hovering over a node.
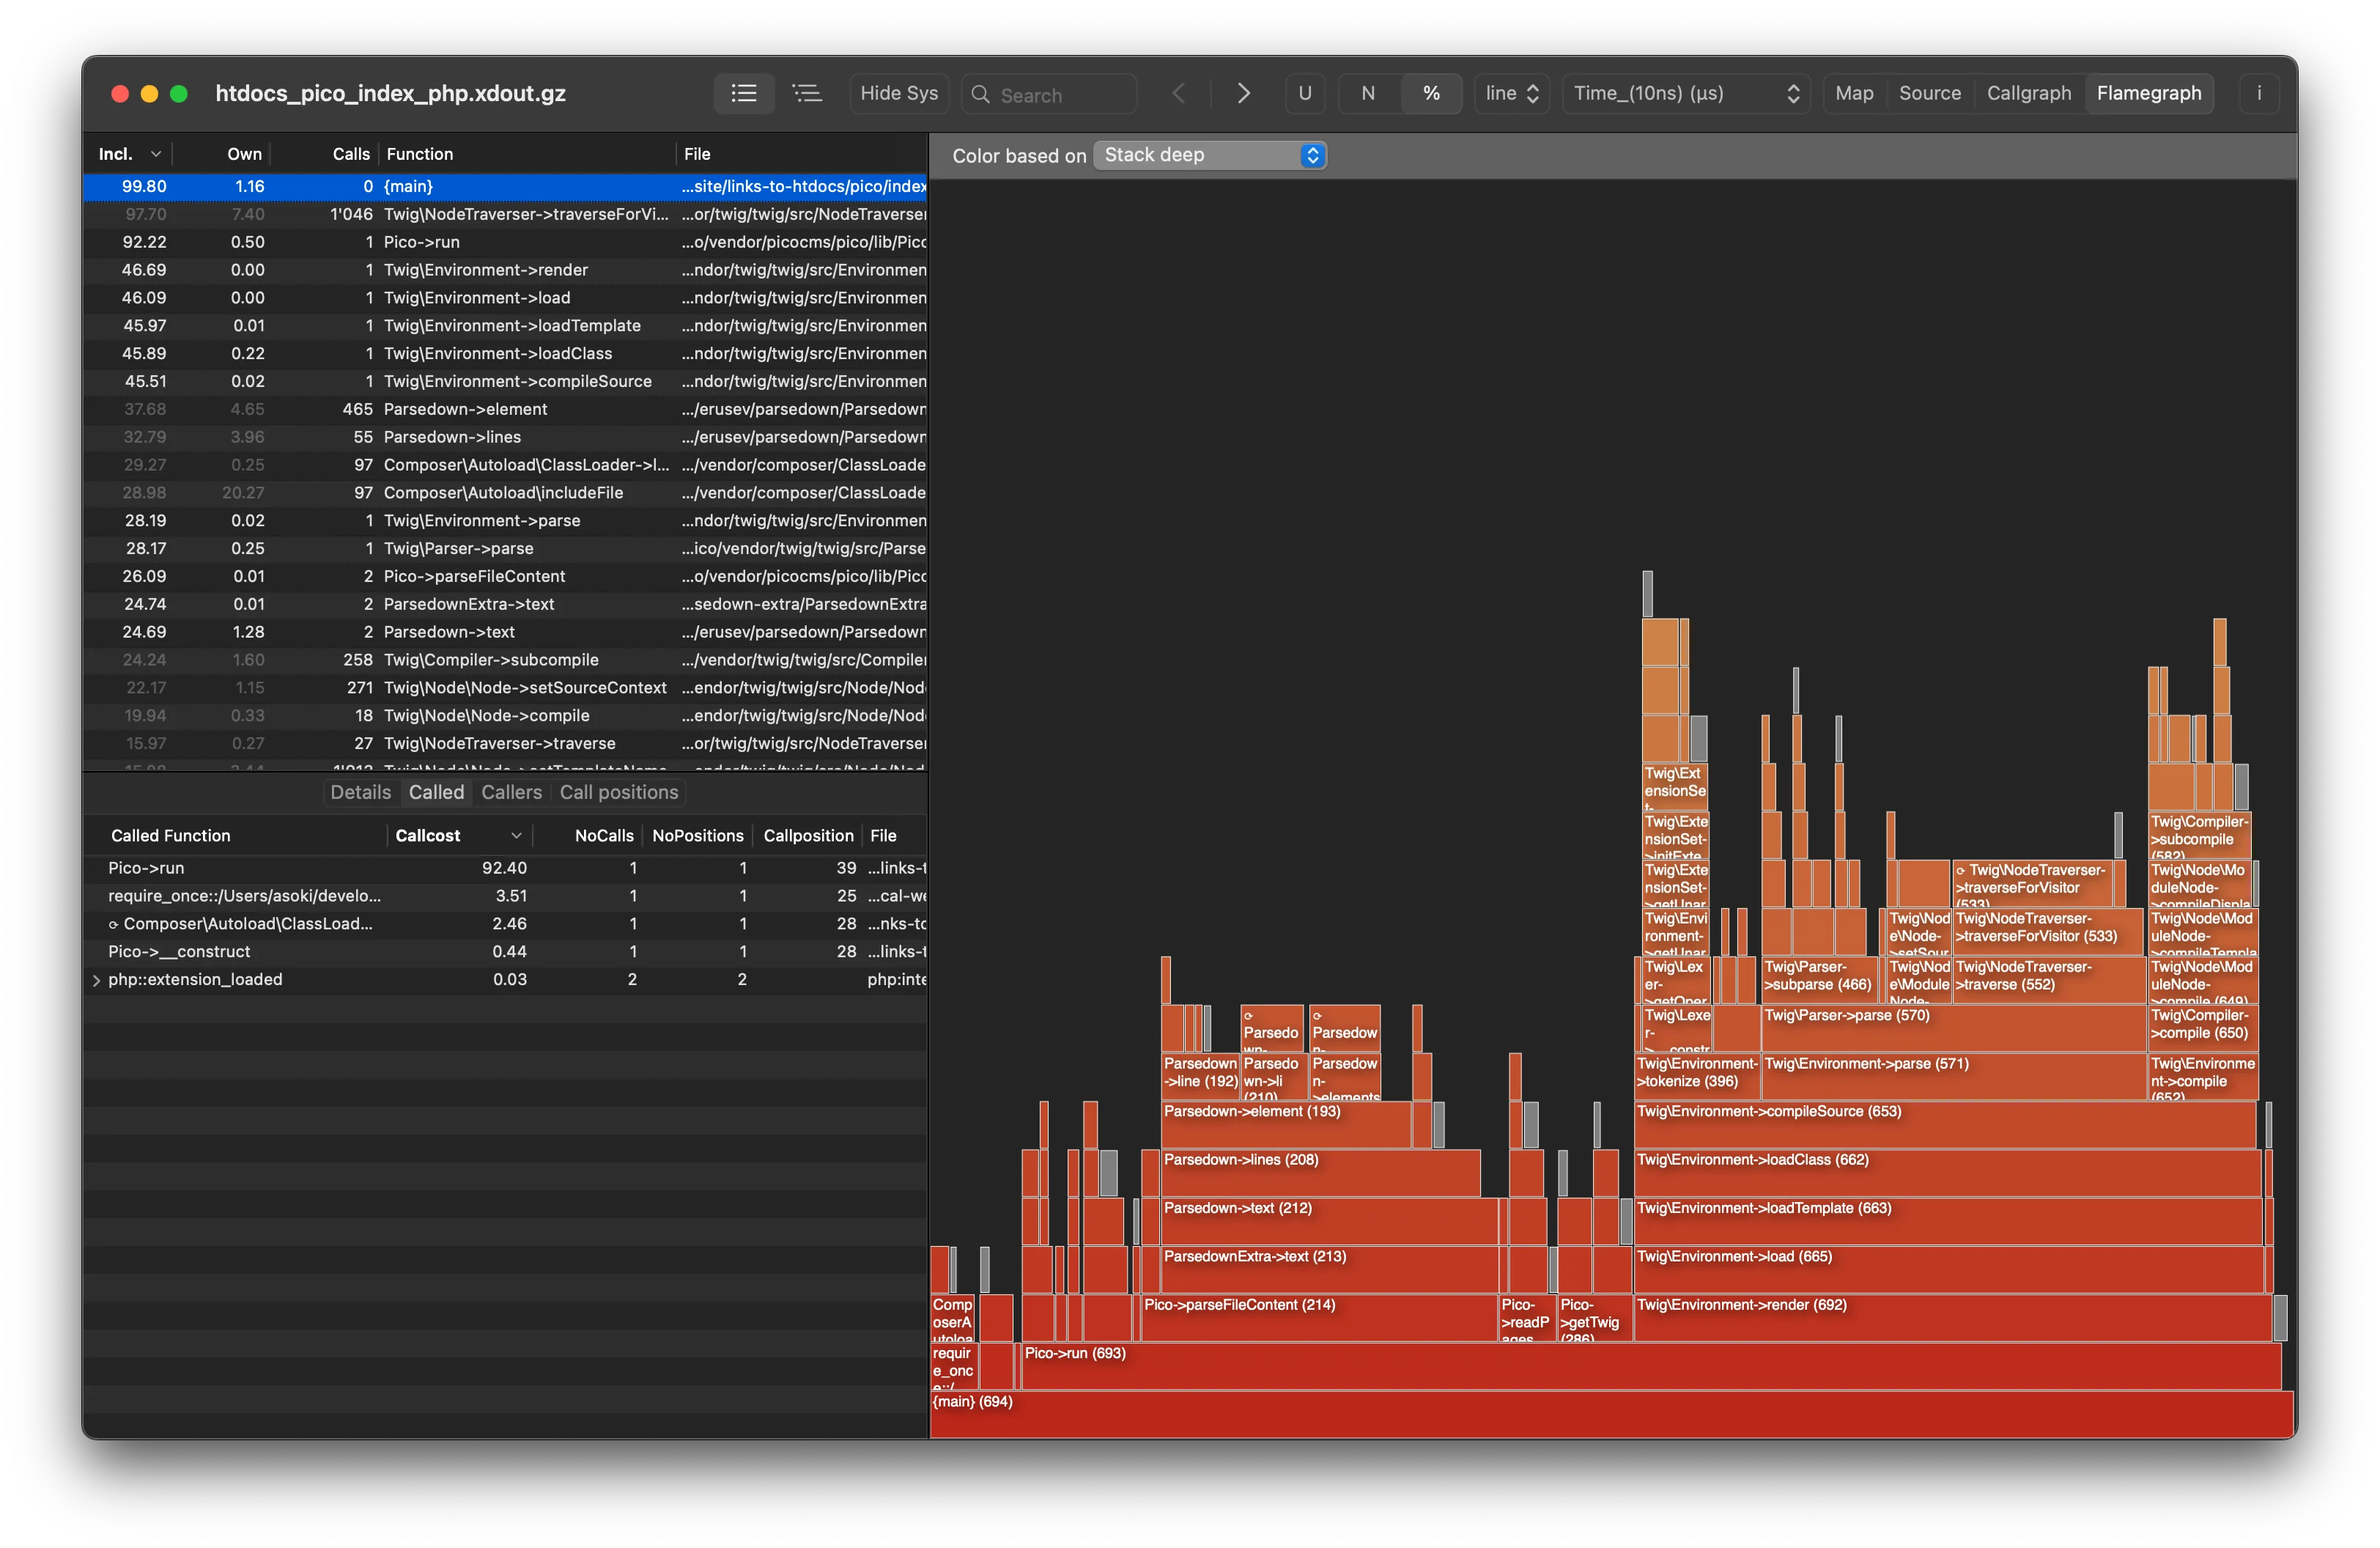
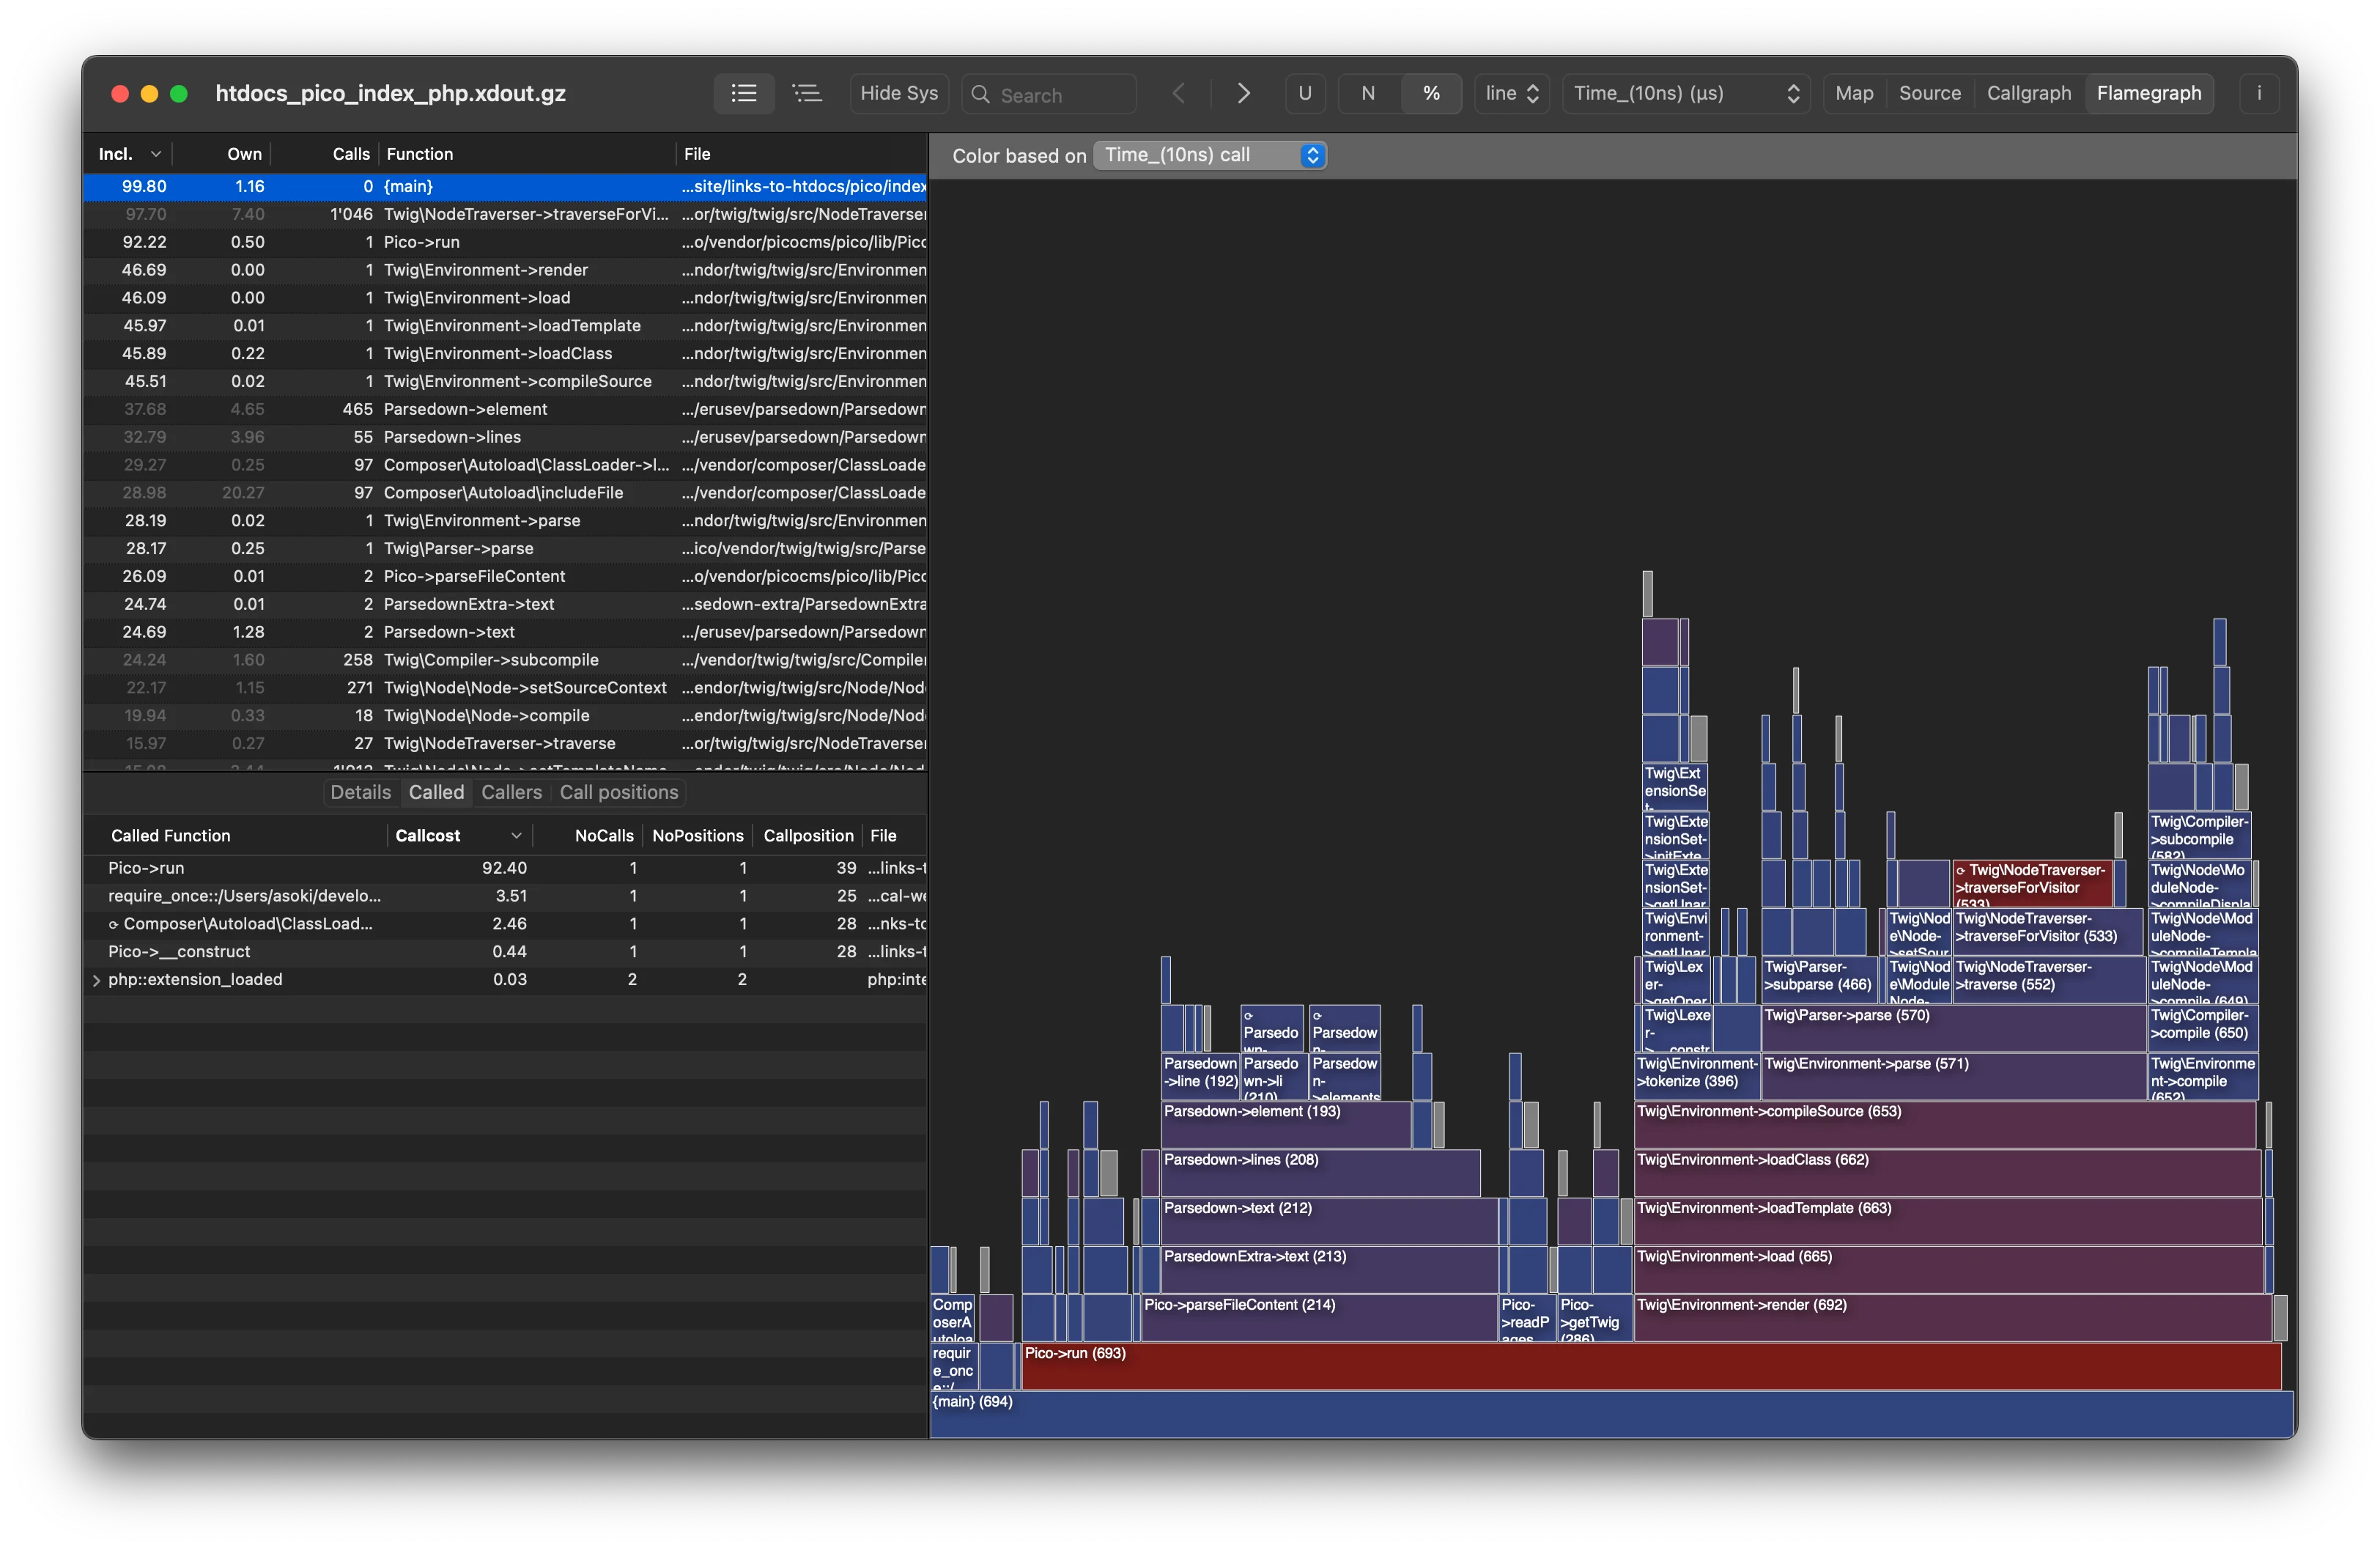
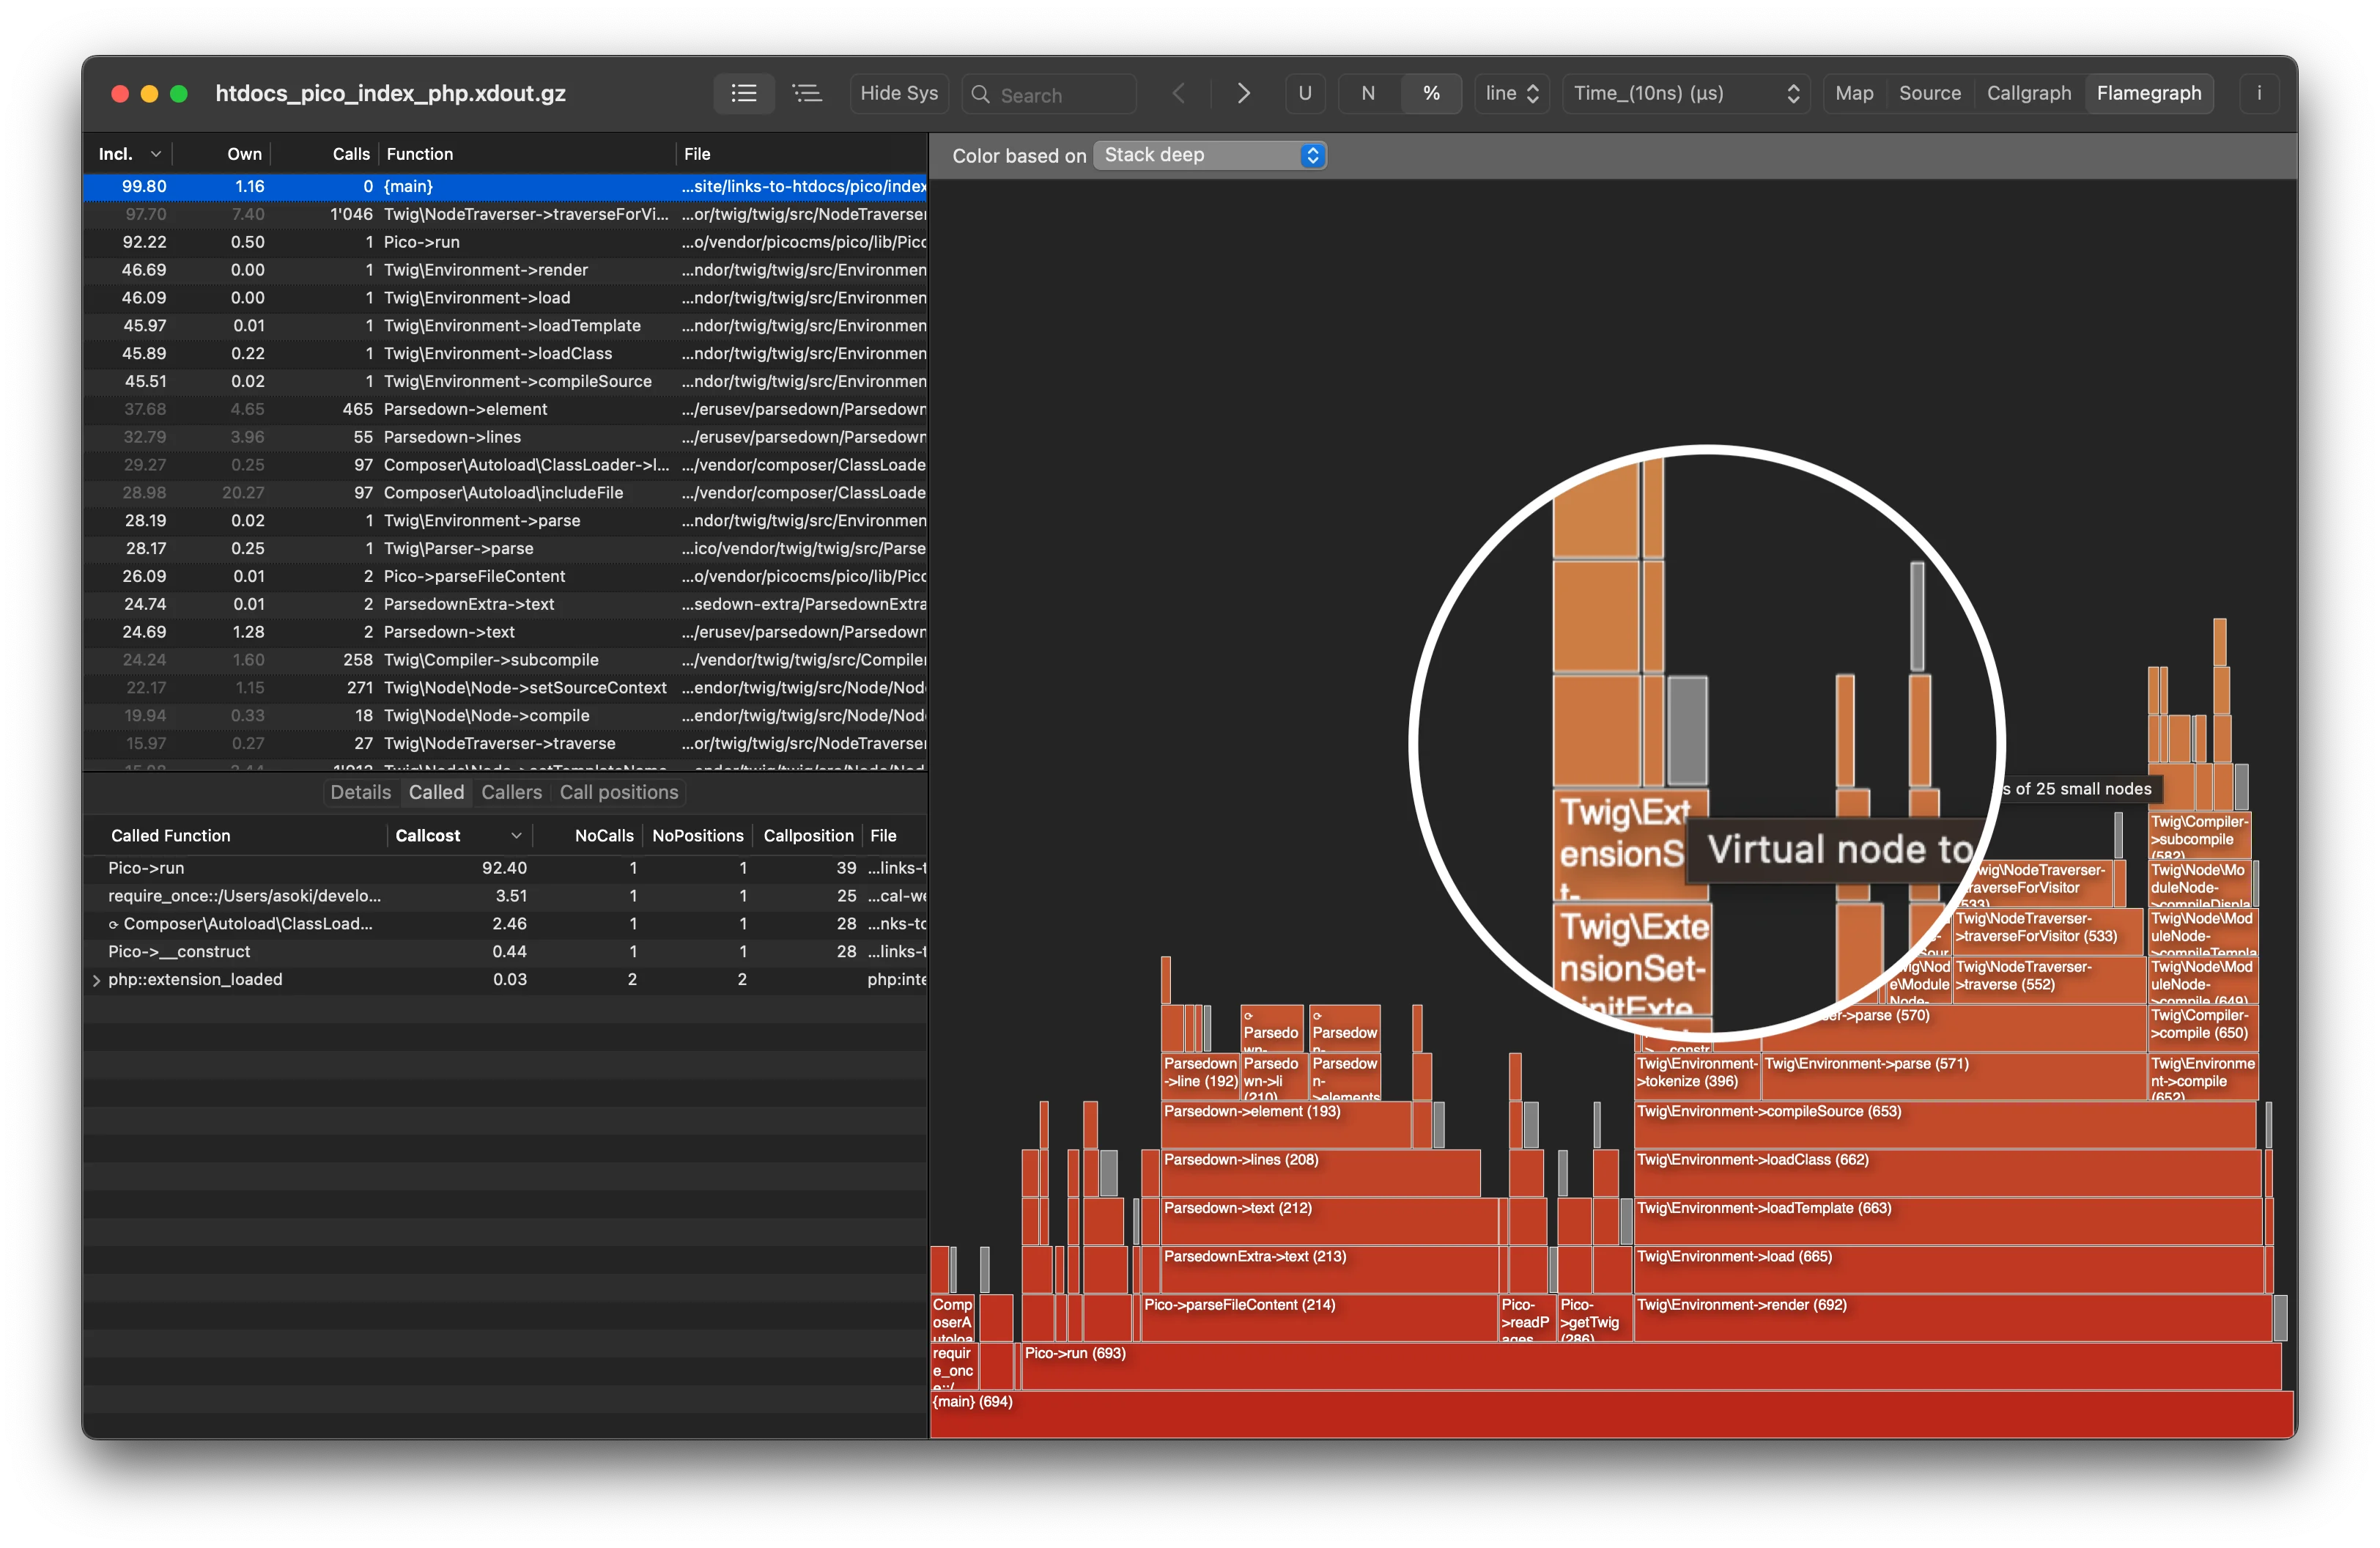
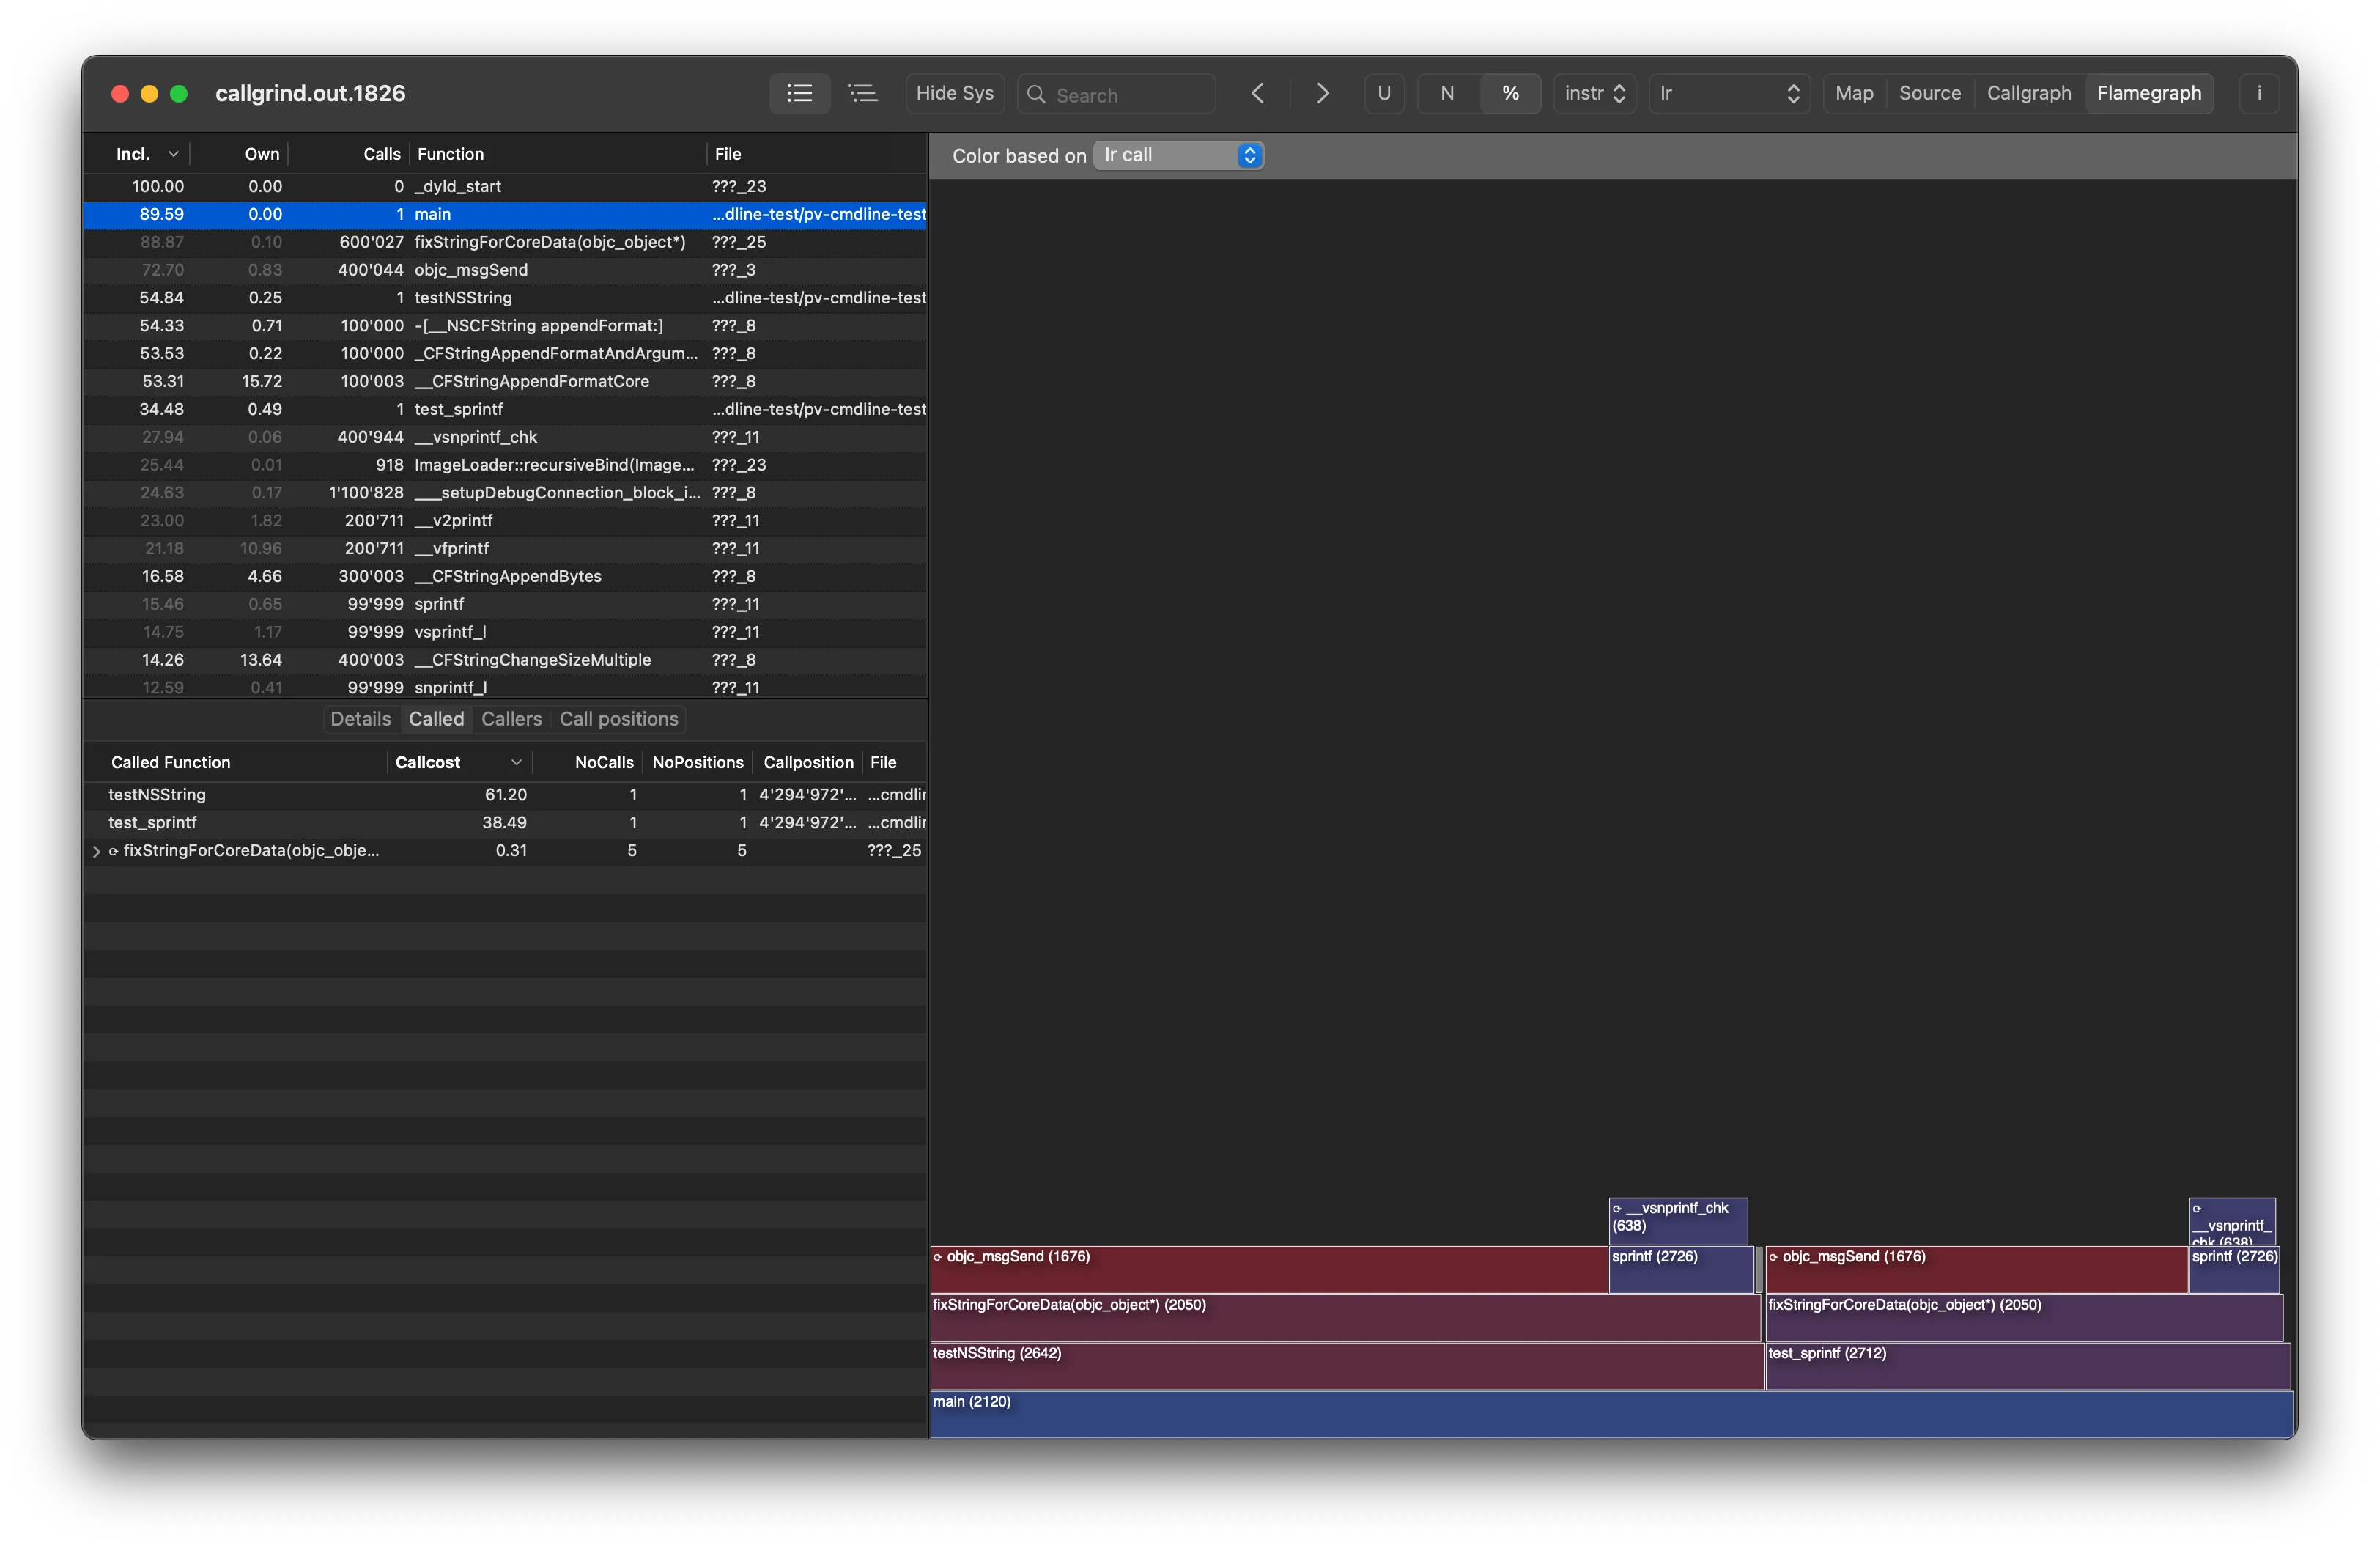
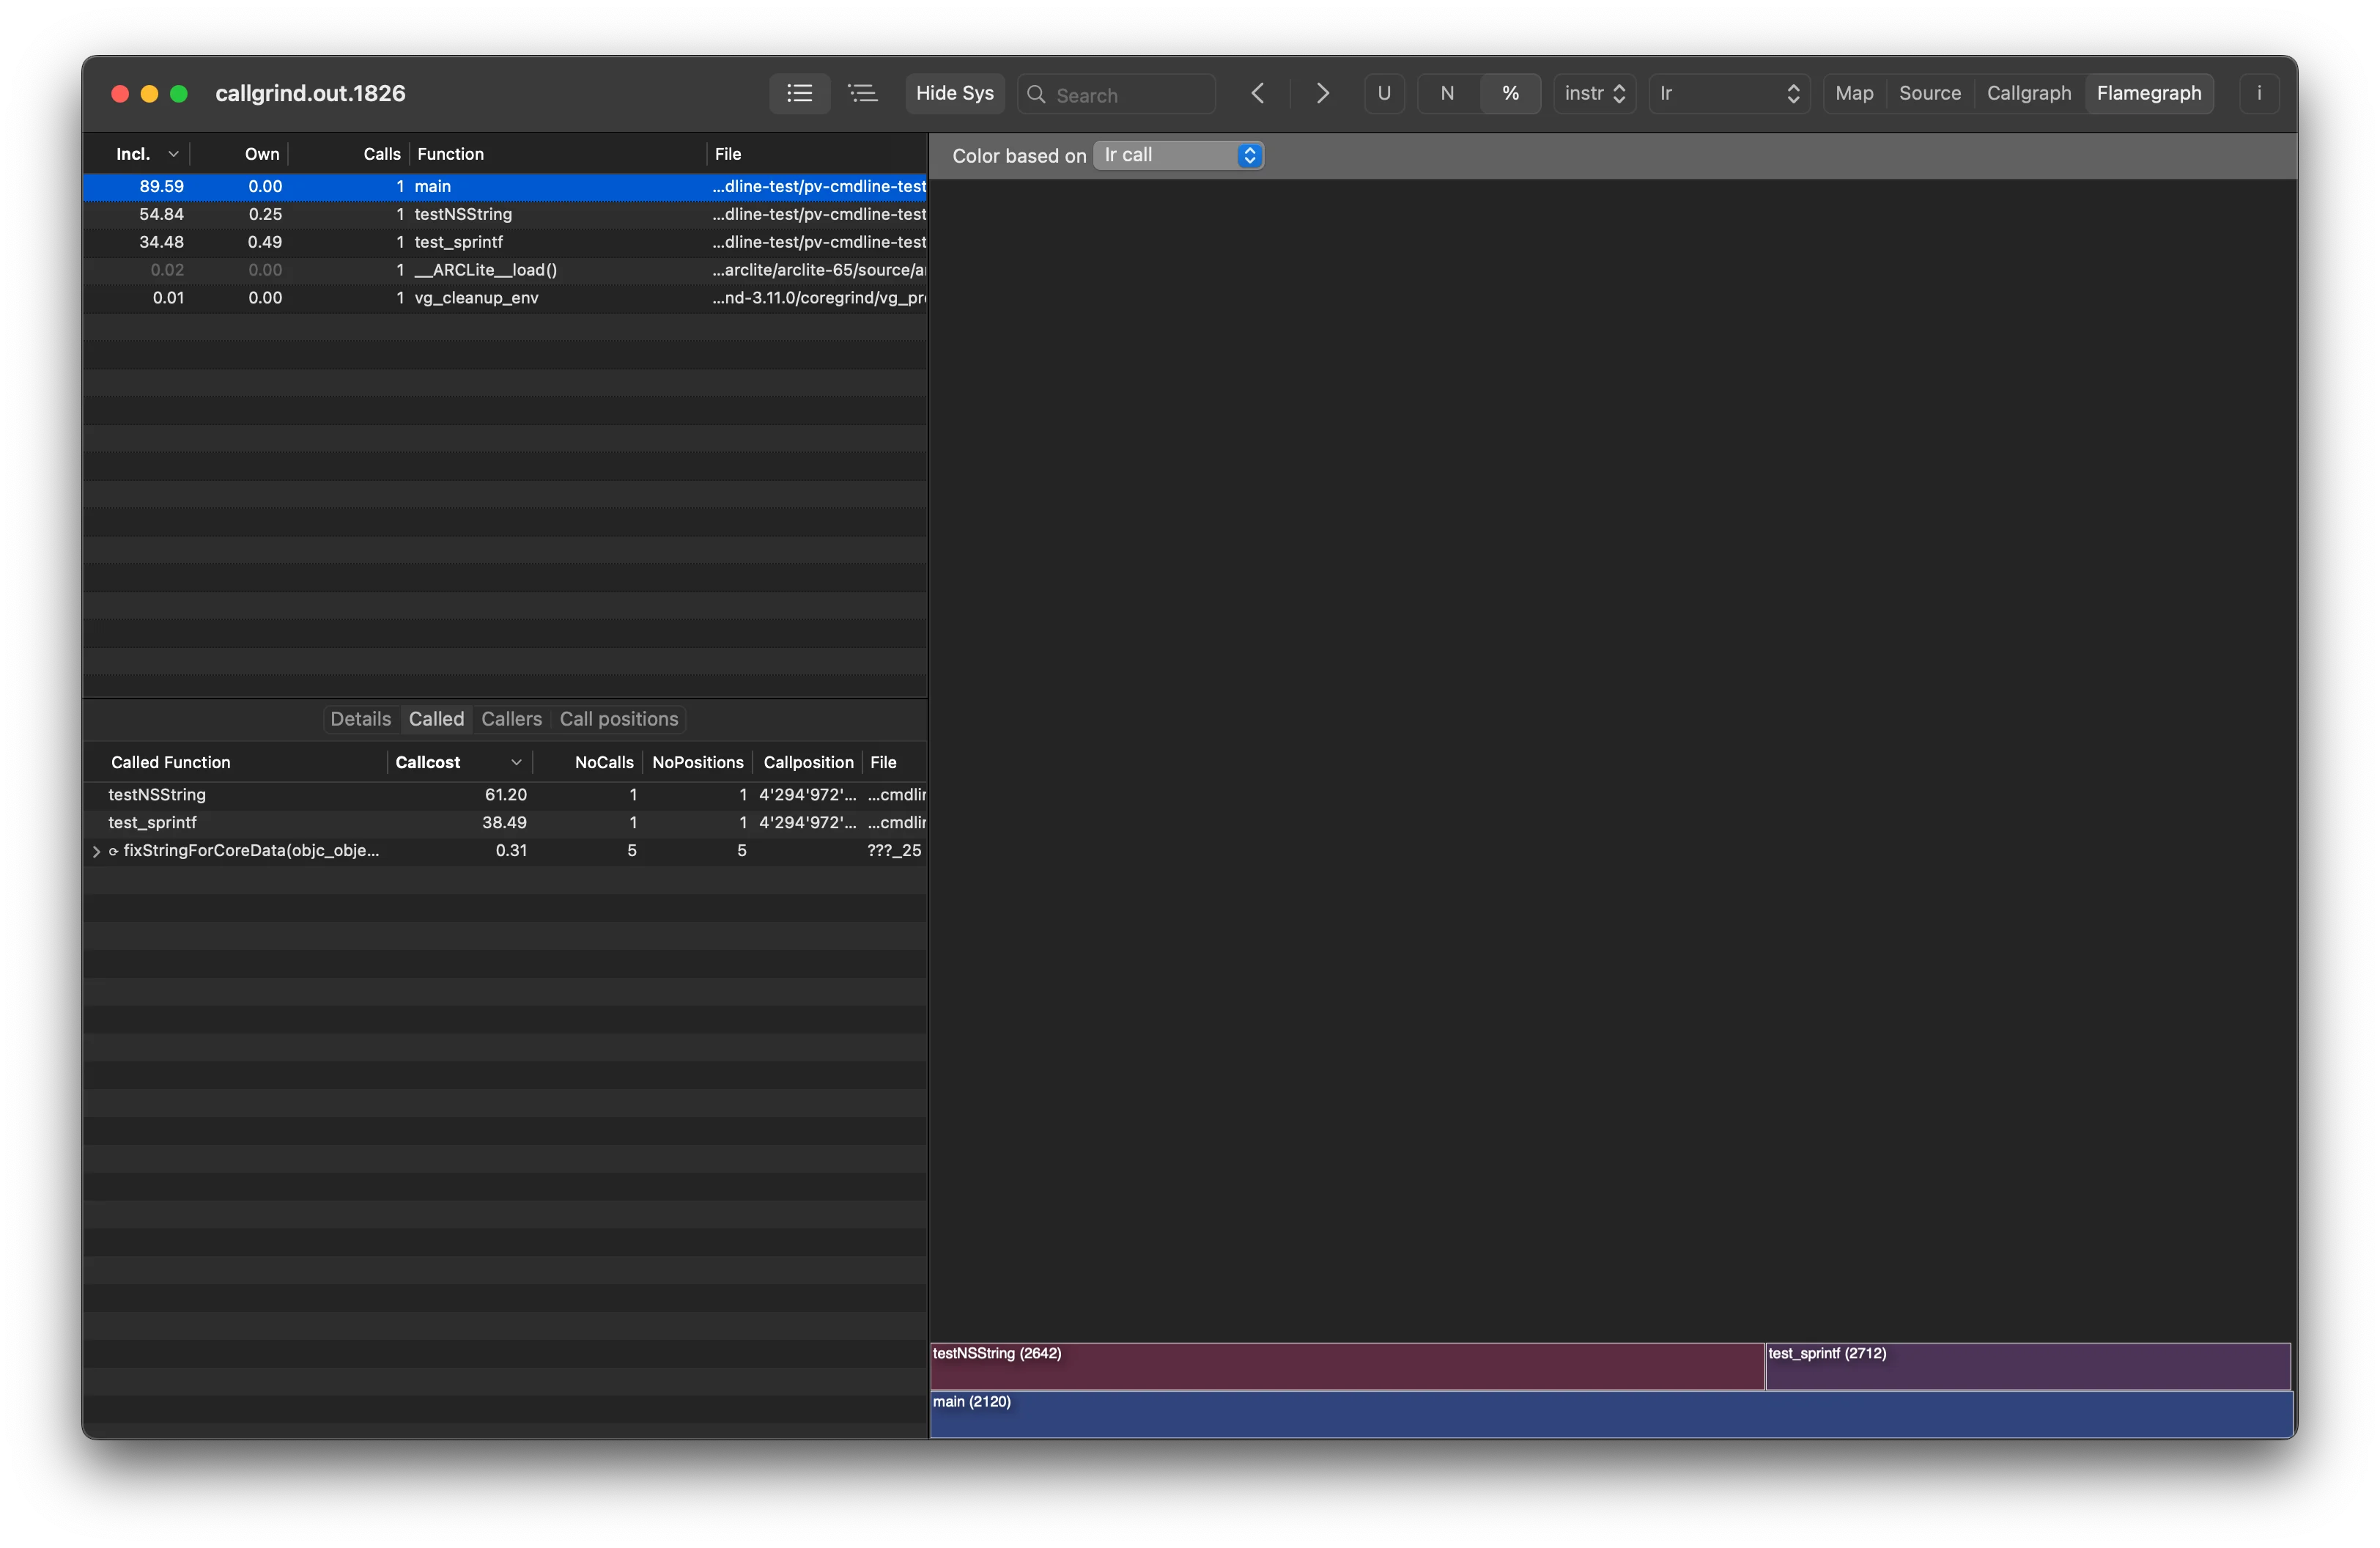
Flamegraph
Visualizing function costs as Flamegraph. The color scheme of the Flamegraph can be selected between palette or heatmap. In heatmap mode, you can combine primary metrics with secondary metrics. The primary metrics (e.g., time) determines the width of the node, while the secondary metrics, (e.g. call count or any other available cost) determines the color of the node on the heatmap.
When a function calls multiple small functions, they may become invisible due to visual limitations imposed by the current screen resolution. To mitigate this issue, ProfilingViewer aggregates the costs of these smaller functions and displays a single gray node, representing the cumulative cost.
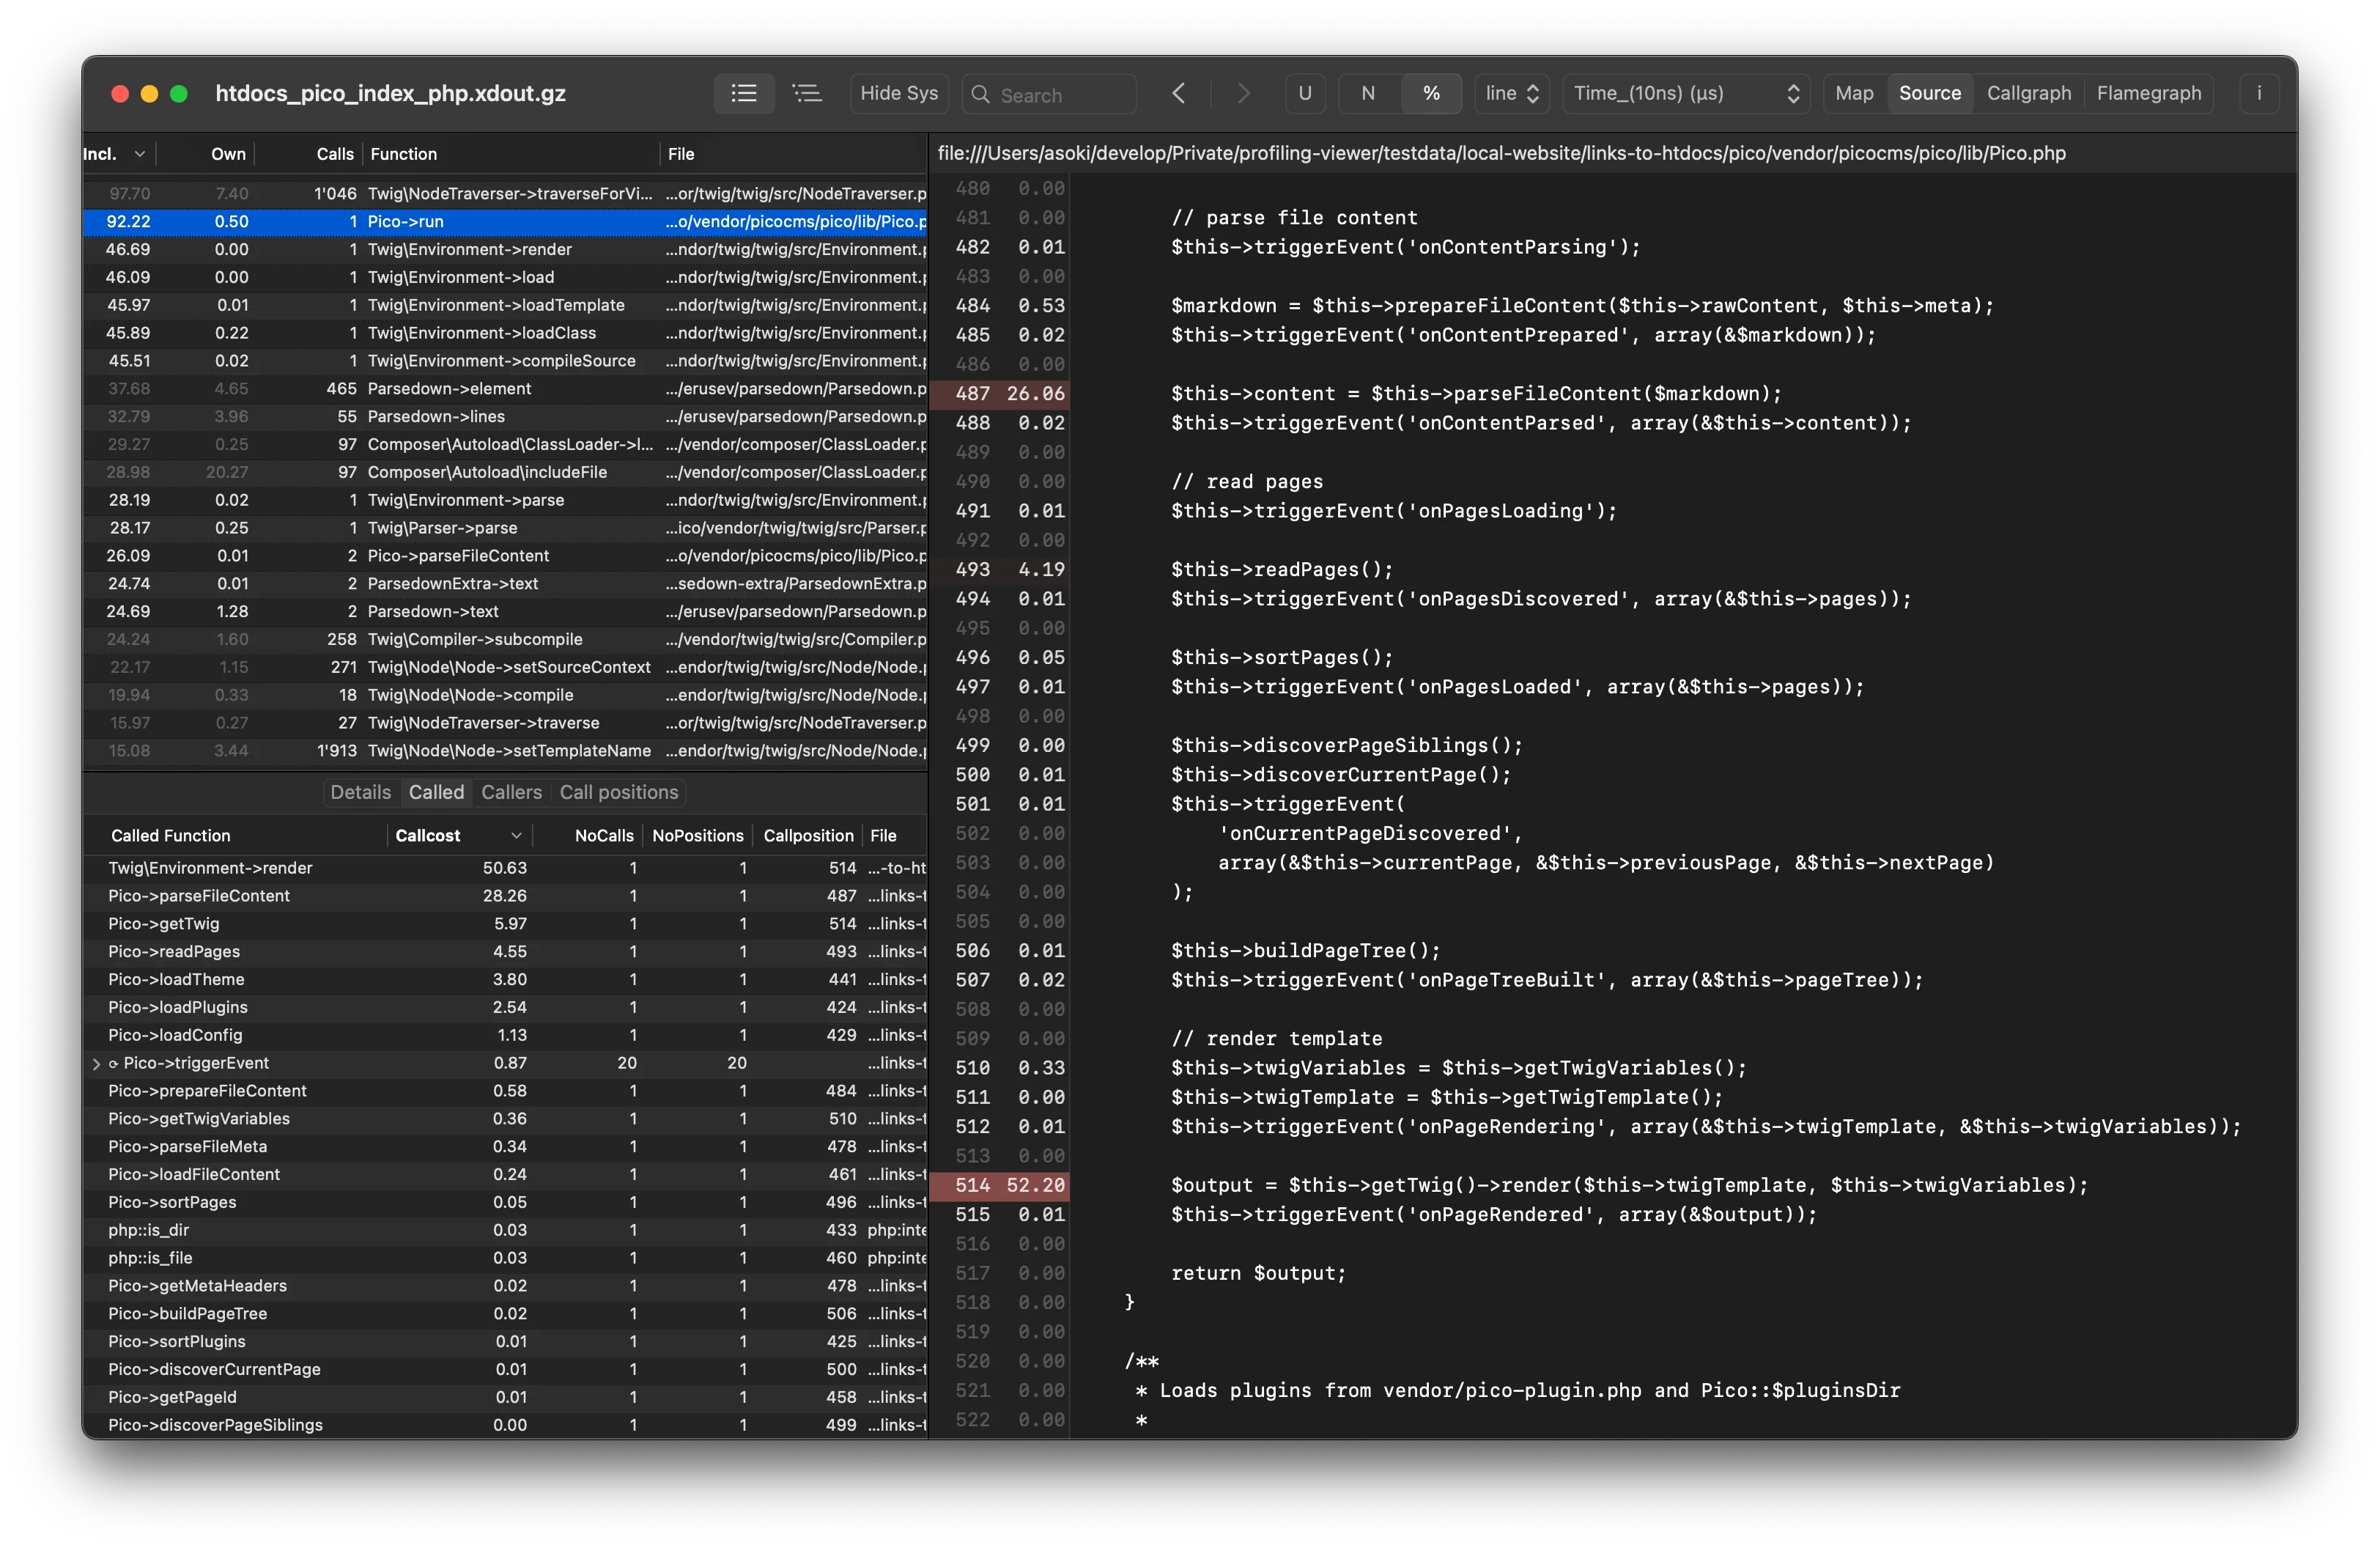
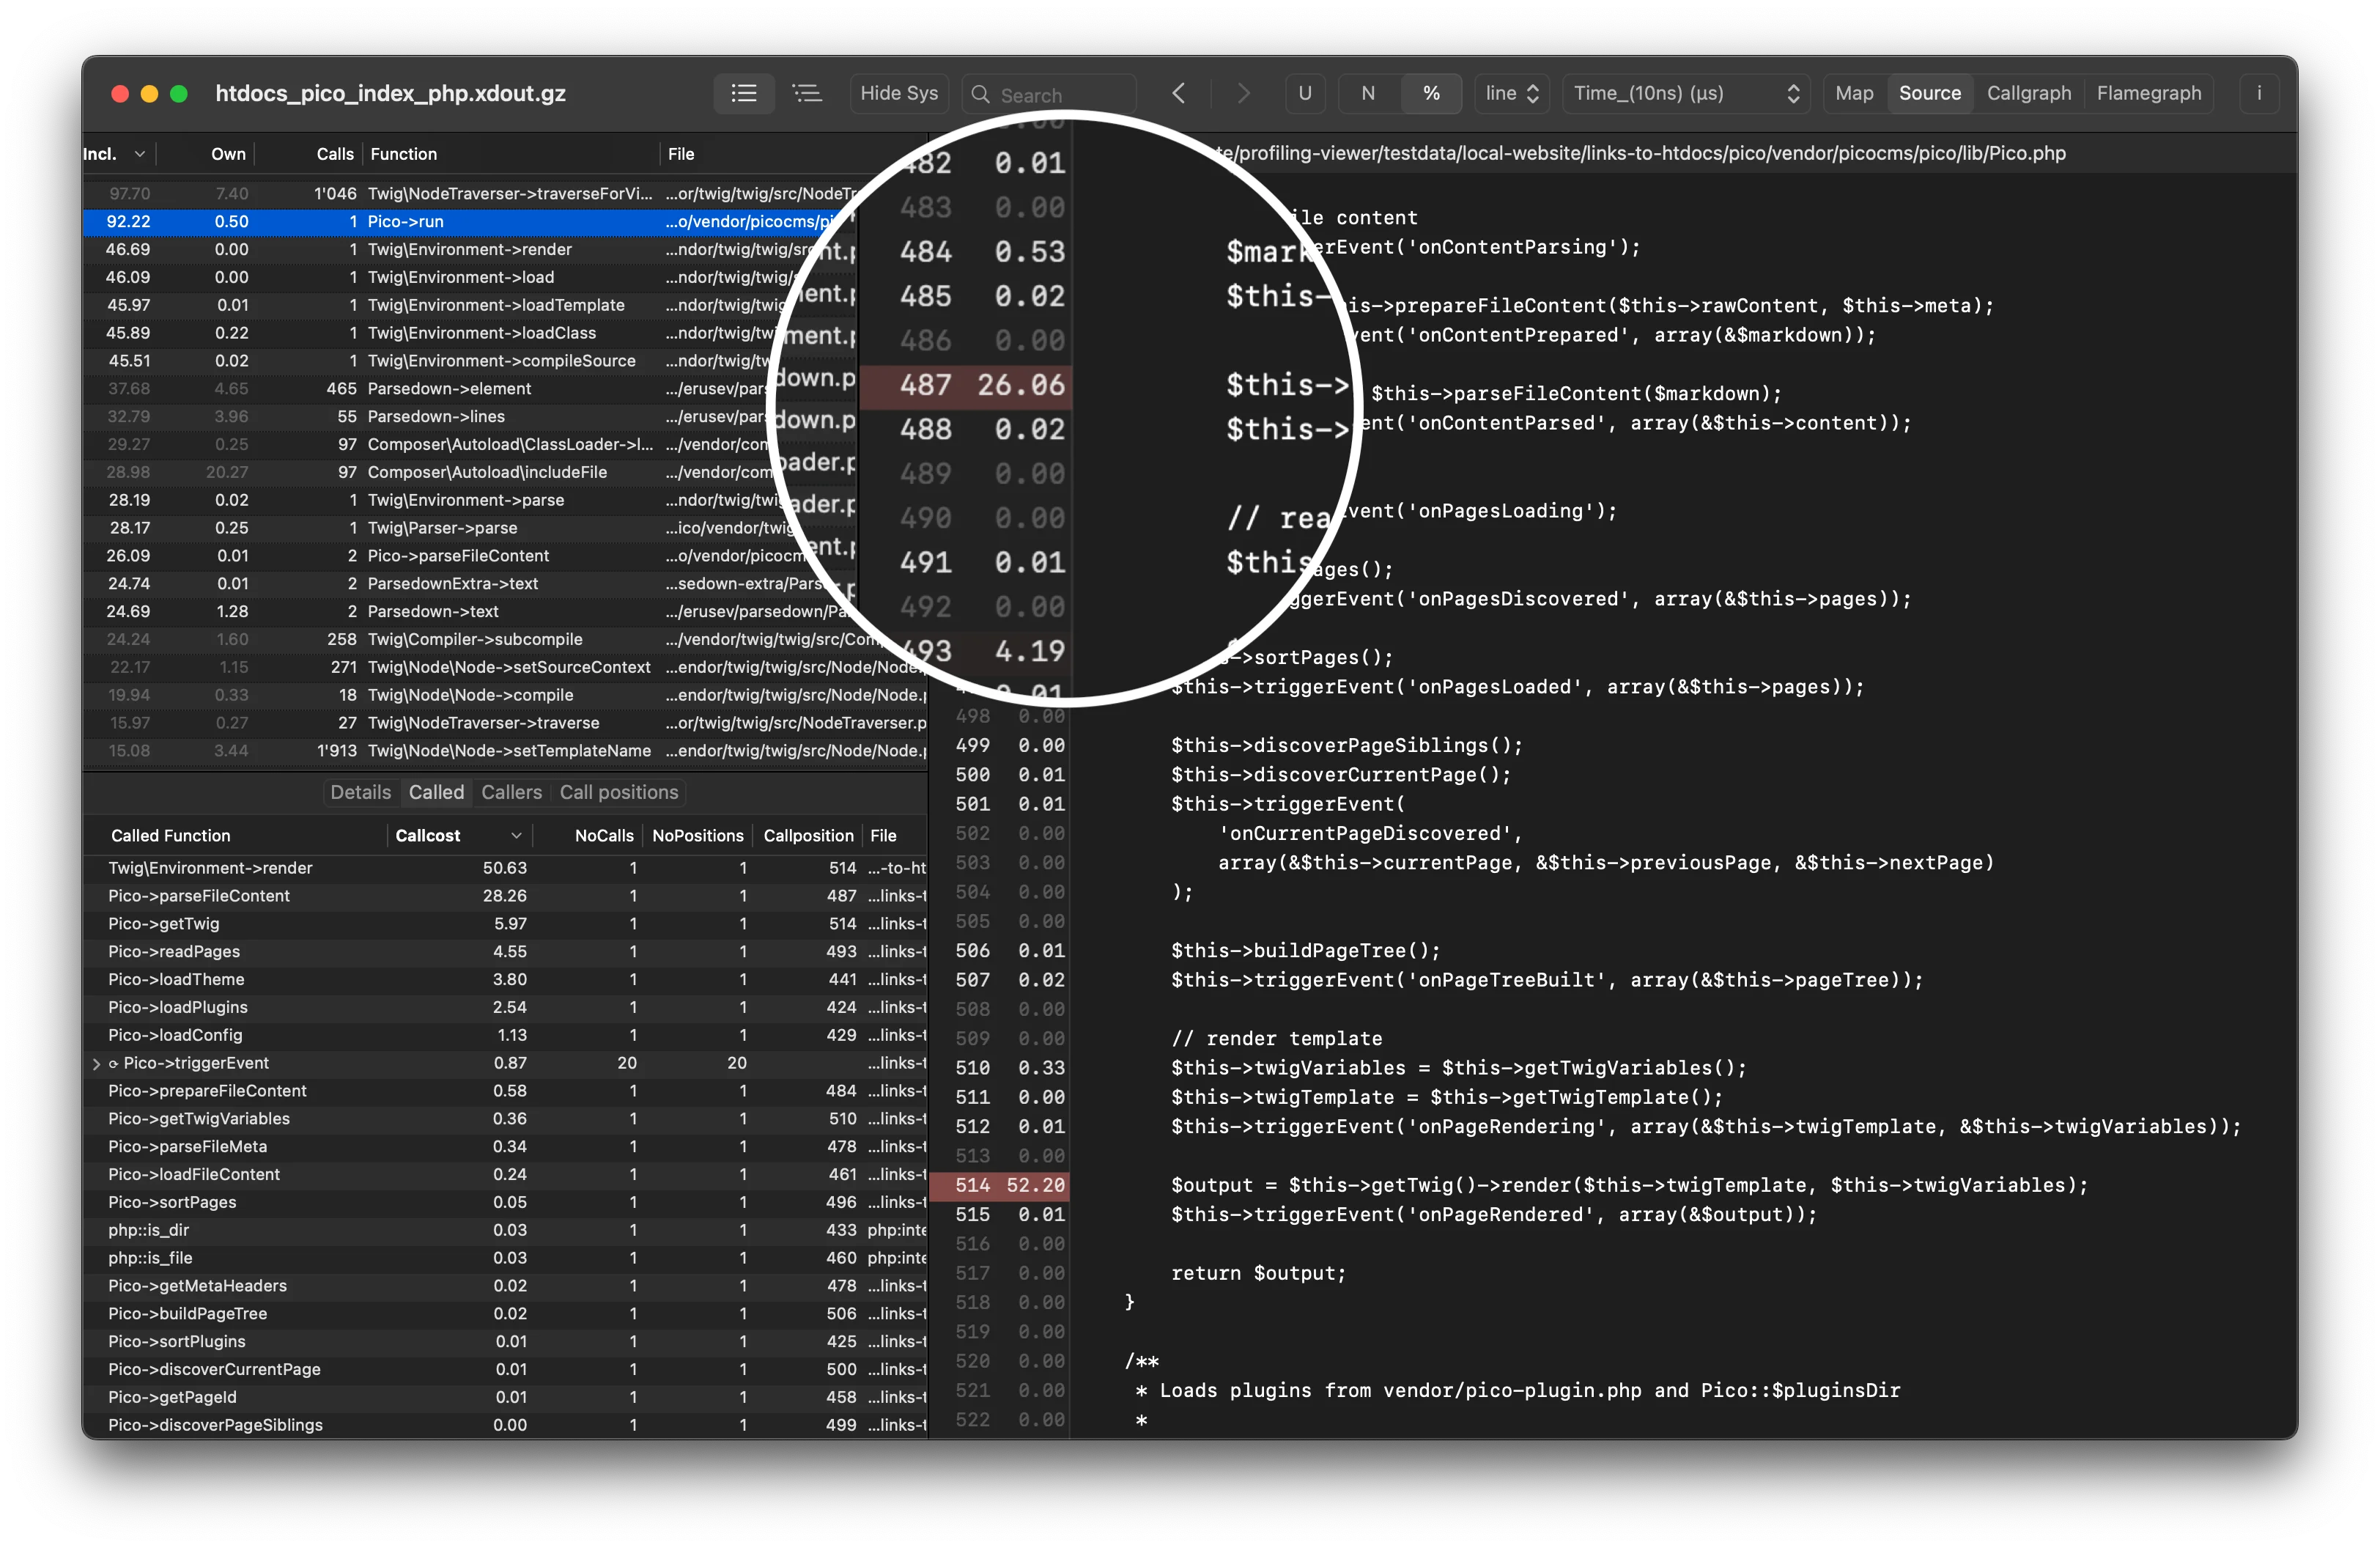
Sourcefile viewer
The loaded source code is annotated with cost information. You can specify the location of your source code and, if needed, how these locations should be mapped to the server path as seen in the callgrind file. Profiling Viewer opens the source code of the selected function and annotates its lines with the corresponding cost information.
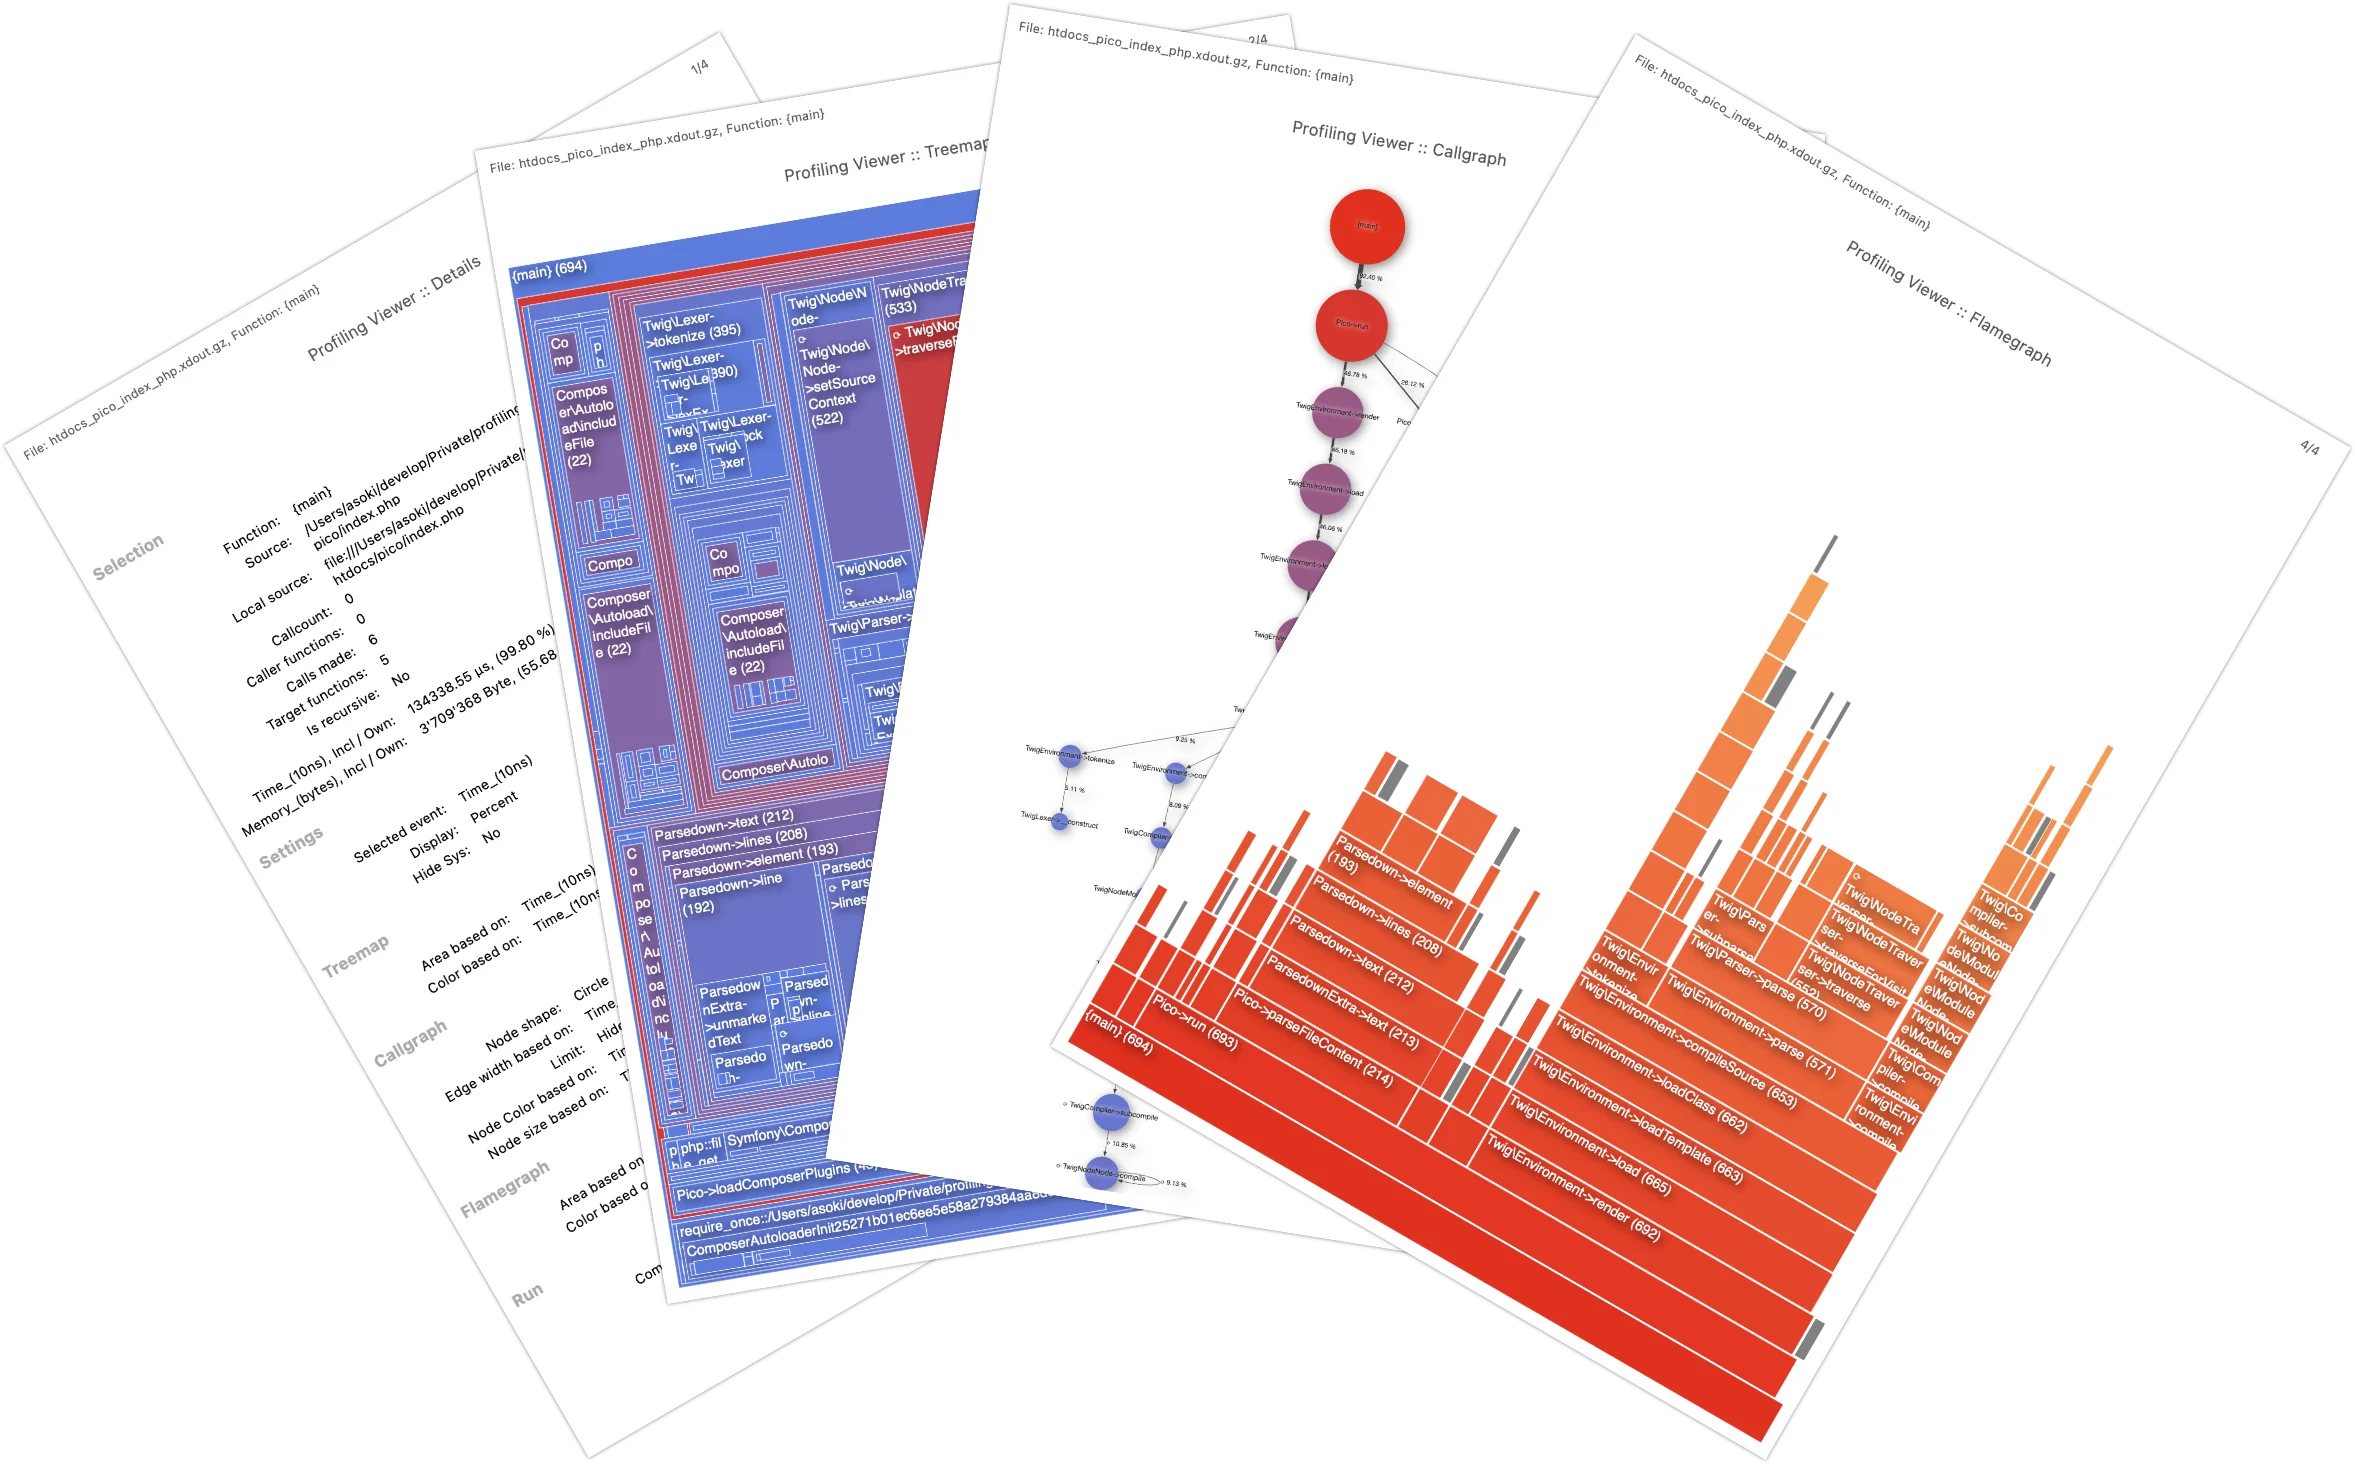
Reports: Print or PDF
Print or export reports as PDF with Treemap, Callgraph and Flamegraph. All diagrams in the PDF file are vector graphics.
Other features
- Supports reading gzip compressed profiling files
- Displays function calls as call tree
- Handles multiple types of costs and positions
- Parses compressed callgrind files
- Displays costs as raw data, as selected unit or as percent
- Navigation history
- Supports Dark Mode
- Runs natively on both Apple silicon and Intel® based Mac computers
- Works with macOS 15 (Sequoia), 14 (Sonoma), macOS 13 (Ventura), macOS 12 (Monterey), 11 (Big Sur), 10.15 (Catalina), 10.14 (Mojave), 10.13 (High Sierra), 10.12 (Sierra), 10.11 (El Capitan), 10.10 (Yosemite), 10.9 (Mavericks)
- Small memory footprint (for example, approximately 280 MB memory used to open and display a 4.6 GB callgrind file generated by xdebug)
- Opens callgrind files generated by Valgrind, Ruby ruby-prof, the Xdebug extension for PHP, php-memprof, Python cProfile with pyprof2calltree, gpertools pprof, go programs with pprof, Node.js with nodegrind and most other callgrind files
- You can open callgrind files via Command Line too